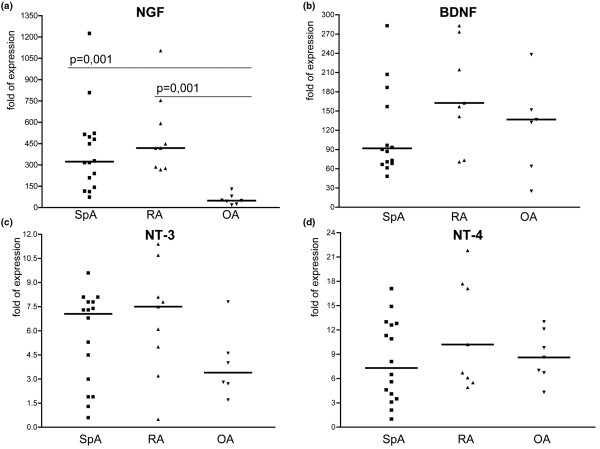
Figure 1.
Scatter plots showing mRNA expression of the neurotrophic ligands. The scatter plots a to d depict the expression levels of the four neurotrophic ligands. (a) nerve growth factor (NGF). (b) Brain-derived growth factor (BDNF). (c) Neurotrophin (NT)-3. (d) NT-4). Bold horizontal lines represent the median. The highest levels were found for BDNF and NGF. Significantly higher expression was revealed for NGF in both spondyloarthritis (SpA) and rheumatoid arthritis (RA) as compared with osteoarthritis (OA; P = 0.001 for both comparisons).

