
Figure 2.
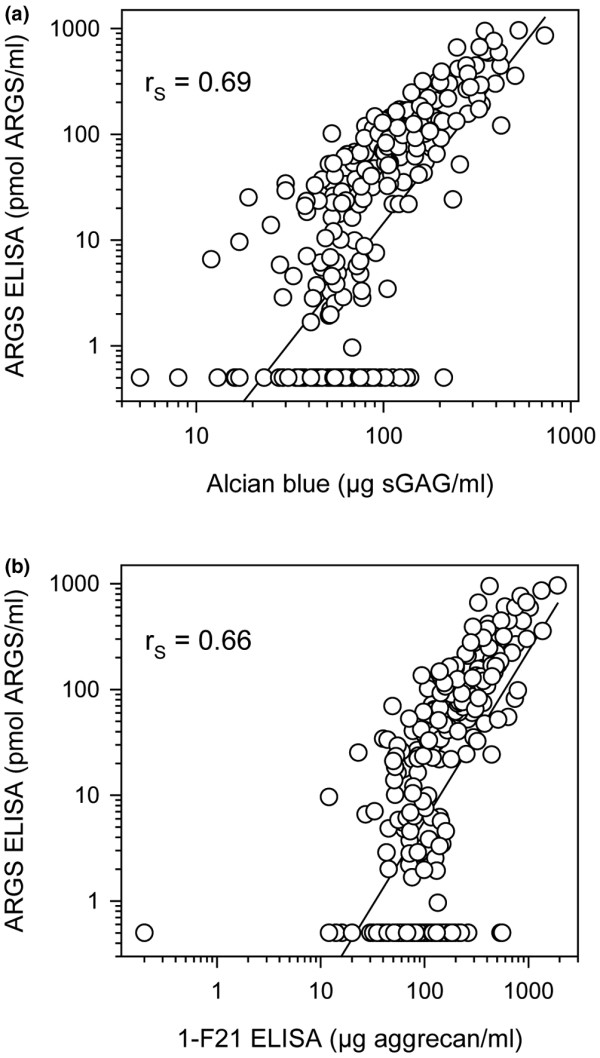
Regression analysis of aggrecan fragment data. The same samples of synovial fluid were analyzed by three different assays (see Material and Methods for details). Concentration of aggrecan fragments carrying the neoepitope ARGS by ELISA versus (a) sGAG concentration by Alcian blue precipitation (n = 293) and versus (b) aggrecan concentration by 1-F21 ELISA (n = 285). Solid lines show the first-order regression. Note the logarithmic X- and Y-axes. Spearman's rank order correlations (rS) are given for each relationship with P < 0.0001.