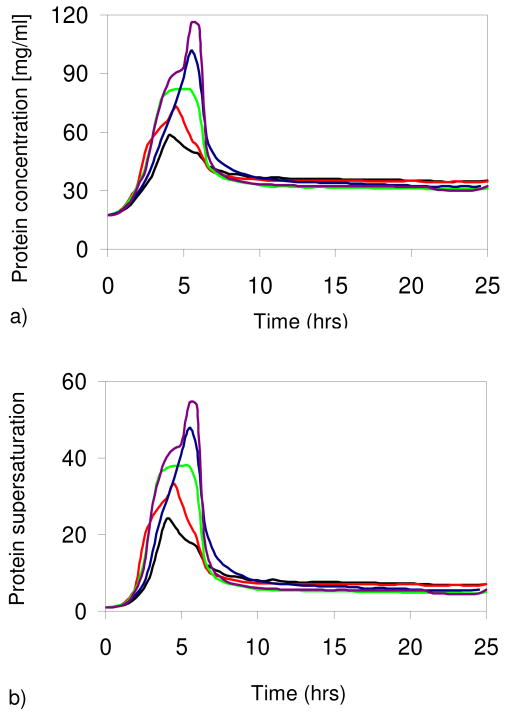
Figure 1.
(a) Protein concentration (C) and (b) supersaturation (C/Cs) in five sets of droplets with 4M NaCl in the reservoir. Black lines: reservoir 1 (R1) with quench time Δt = 4 h. Red: R2 with Δt = 4.5 h. Green: R3 with Δt = 5 h. Blue: R4 with Δt = 5.5 h. Purple: R5 with Δt = 6 h. (Online in color.)

