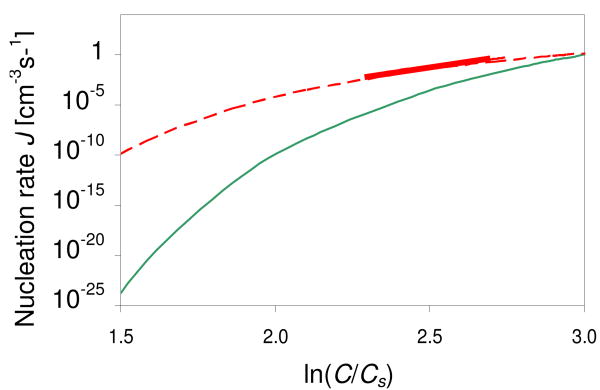
Figure 6.
Crystal nucleation rate J as a function of supersaturation. Solid (thin) green curve: nucleation rates calculated using our fitting parameters A = 6.2·105 mg-1s-1 and B = 160 (extracted from a crystallization experiment with initially 3.5% NaCl), for protein solubility Cs = 5 mg/ml and a range of protein concentrations (20 mg/ml to 100 mg/ml). Dashed red curve: nucleation rates calculated using the fitting constants of Galkin and Vekilov (A = 18 mg-1s-1 and B = 65, extracted from a crystallization experiment with 2.5% NaCl). Solid (thick) red curve: experimental data of Galkin and Vekilov at Cs = 5. (Online in color.)

