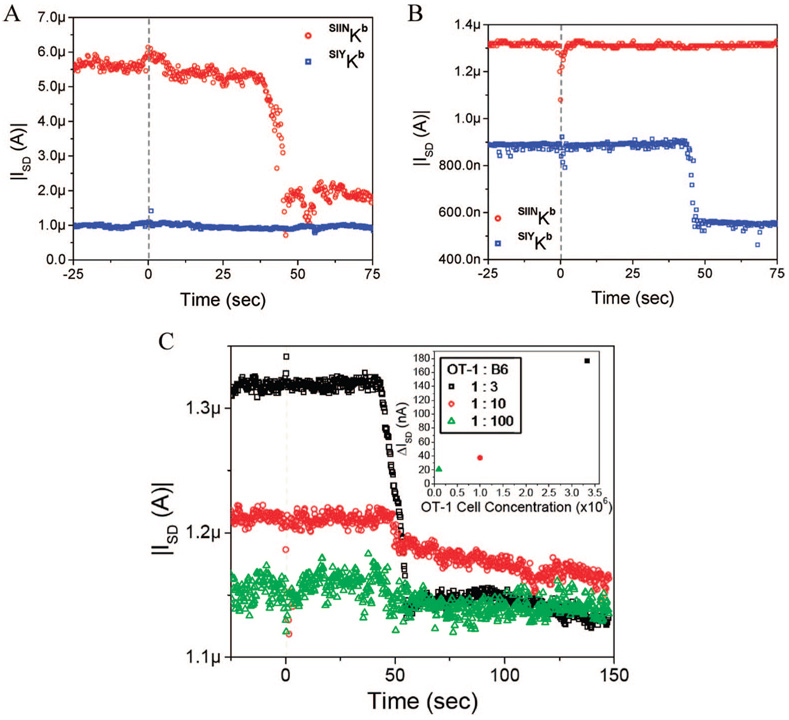
Figure 3. Antigen-specific CTL response.
(A) OT-1 and (B) 2C splenocytes stimulated with SIINKb and SIYKb dimeric constructs. For both positively stimulated splenocyte populations (OT-1 with SIINKb and 2C with SIYKb), extracellular acidification began at ~40 s. Different devices were used for each measurement. (C) OT-1 splenocytes were diluted at various ratios with wild-type B6 splenocytes; CTL response to stimulation with SIINKb was measured. The |ISD| values before and after the onset of extracellular acidification are significantly different at the 99.9% confidence level for all dilutions (t test). The same device was used for all measurements. No significant response was observed for a 1:1000 dilution. The inset shows a plot of the observed change in |ISD| versus the OT-1 cell concentration for these measurements.

