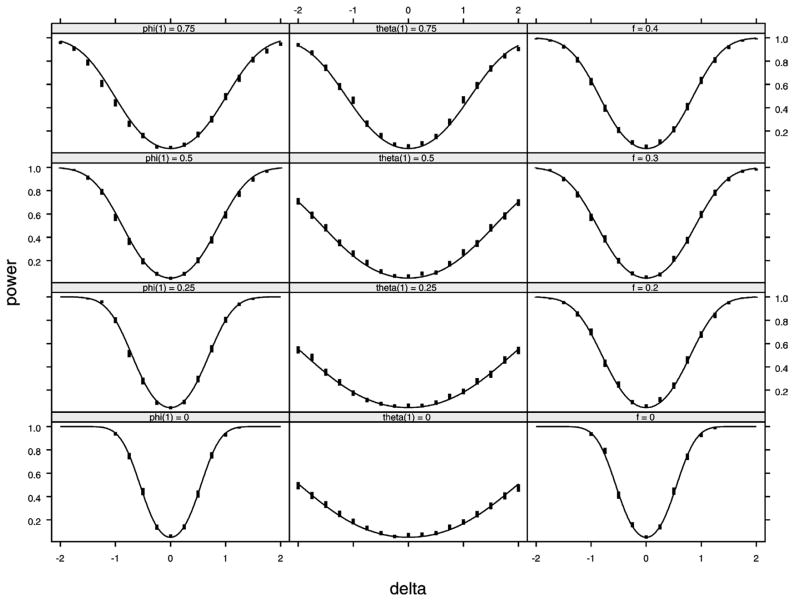
Figure 2.
Comparison of Empirical and Theoretical Asymptotic Power in the SIA Model With AR(1), IMA(1), and Fractionally Differenced White Noise. The parameter δ = ω/σ is the rescaled step size. The solid curve shows the theoretical power defined in (10). The vertical bars show the width of a 95% confidence interval for the empirical power in 1,000 simulations of the model. The AR(1) and IMA(1) parameters φ1 and θ1 are denoted by phi(1) and theta(1).

