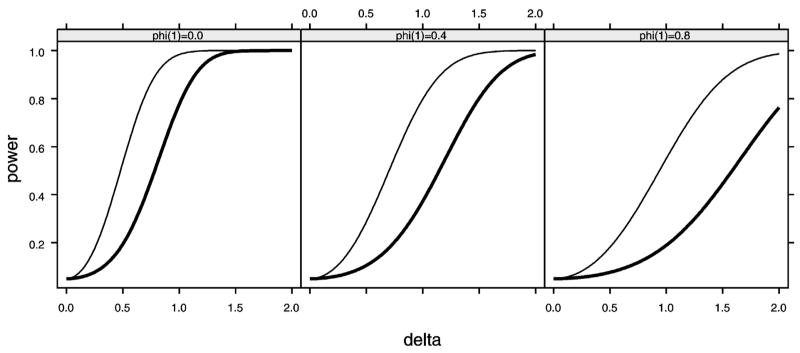
Figure 3.
Comparison of Power Functions for a SIA Model With a Step Intervention With AR(1) Errors and the Forecast-Actuality Significance Test for a Two-Sided Test at the 5% Level. The model parameters are n = 120, T = 101, delta = δ = ω/σ, and phi(1) = φ1. The solid thin curve shows the SIA model-based hypothesis test, and the solid thick curve shows the omnibus significance test using Q. Because both power functions are symmetric about δ = 0, only the upper half is shown.

