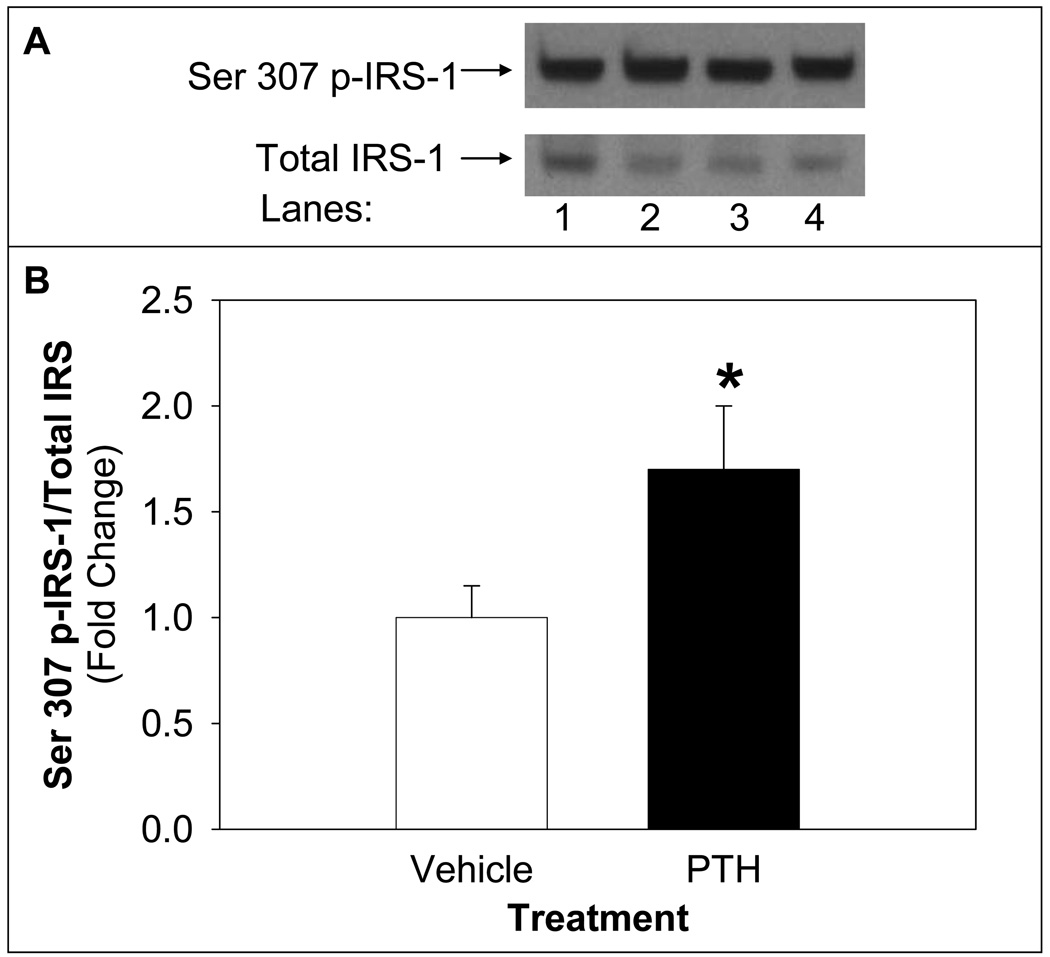
Figure 5. PTH Treatment Decreased Phosphorylation of IRS-1 on Serine 307 Site.
Differentiated adipocytes were treated with PTH (10 nM) for 24 h followed by insulin stimulation (100 nM) for 20 minutes. Cell lysates were probed for serine 307 phospho-IRS-1 (Ser 307 p-IRS-1) and blots were stripped and reprobed for total IRS-1 using Western blotting. A representative blot of Ser 307 p-IRS-1 and total IRS-1 is shown in the upper panel (A) of vehicle treated (lanes 1 and 2) or PTH treated (lanes 3 and 4) of basal (lanes 1 and 3) or insulin stimulated (lanes 2 and 4). Density of signal was quantified (B) and expressed as insulin-stimulated Ser 307 p-IRS-1/total IRS-1 followed by sample/vehicle (mean ± S.E, n=9). Bar with asterisk (*) indicates significant difference from vehicle control, p <0.05.

