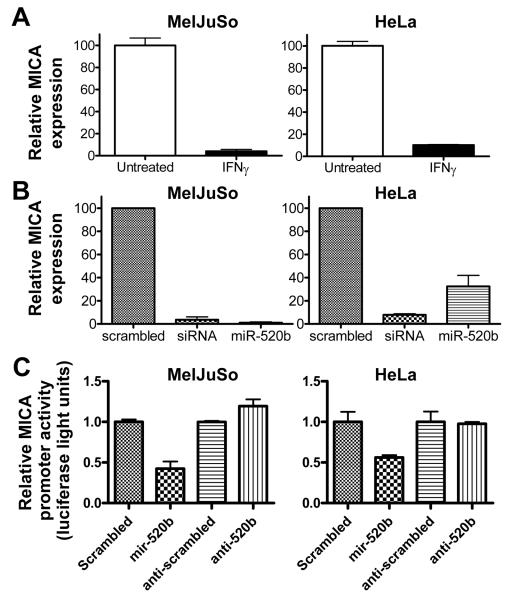
Figure 4. IFNγ and miR-520b down-regulate MICA transcripts.
MICA transcripts were measured from total RNA isolated from cells (A) treated with 100 U/ml IFNγ (closed bars) or medium alone (open bars) or (B) transfected with control scrambled miR, an siRNA pool specific for MICA, or miR-520b. Error bars represent standard deviation of real-time measurements. These results were reproduced at least twice for each cell line. (C) HeLa cell lines were transfected with a luciferase construct containing the 1kb promoter region of MICA (pGL3-MICApro-luc) or a control reporter construct (pGL2-control) along with the reagents specified in the figure. Values are the result of raw firefly luciferase values over raw renilla values normalized to control vector (PGL2-control). Error bars represent standard deviation. These results were reproduced at least once for each cell line and once with the MDA-MB231 cell line.

