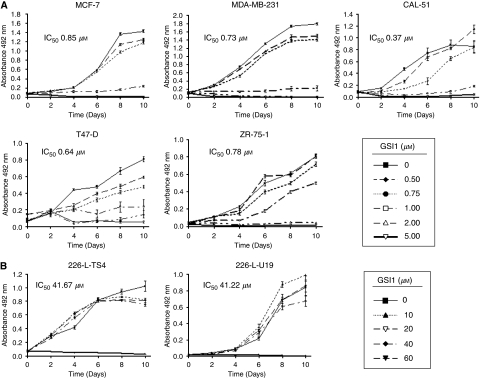
Figure 3.
Cytotoxic effect of GSI1 on breast cancer cells. The effect of increasing concentrations of GSI1 in breast cancer cell lines (A) and non-tumorigenic breast cell lines (B) was determined by staining with SRB. Data represents the average ±s.d. of two independent experiments with six replicates at each time point. The IC50 for each cell line was determined from the corresponding dose–response curves (data not shown) and is indicated.

