
Figure 2.
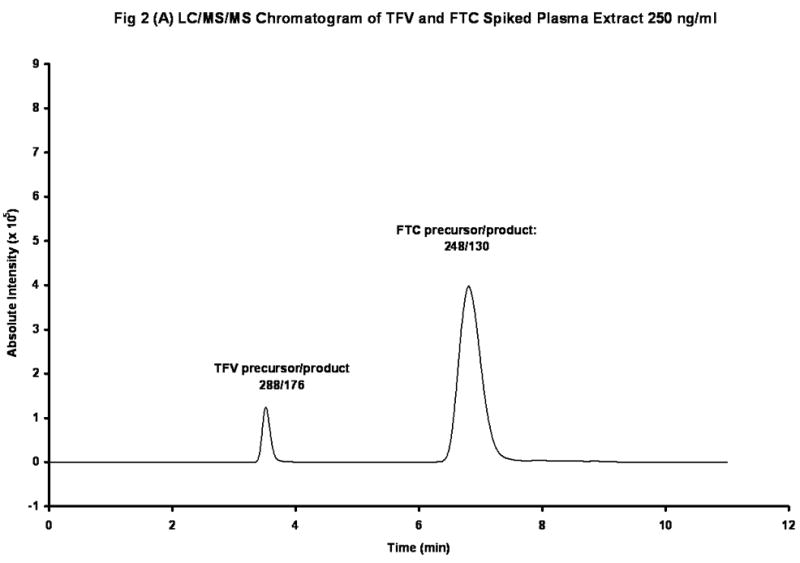
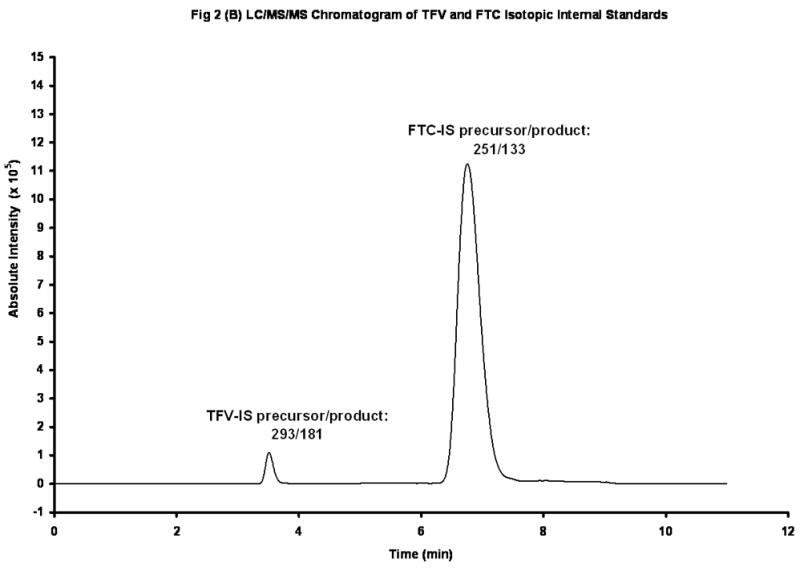

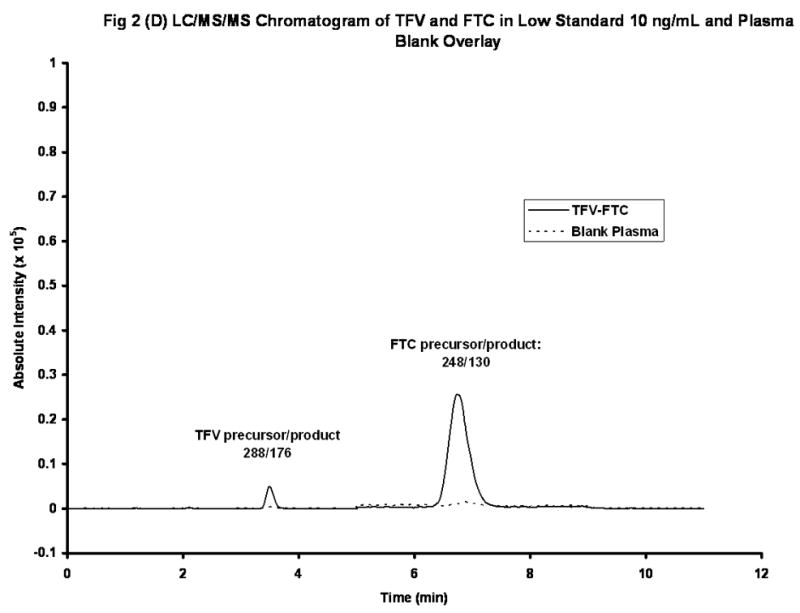
Figure 2(A). LC/MS/MS Chromatogram of TFV and FTC in Spiked Plasma Extract (250 ng/mL). Peak Areas: TFV, 1.16 X 10⁶; FTC, 10.1 X 10⁶.
Figure 2(B). LC/MS/MS Chromatogram of Iso-TFV and Iso-FTC Internal Standards. Peak Areas: Iso-TFV, 1.24 X 10⁶; Iso-FTC, 33.1 X 10⁶.
Figure 2(C). LC/MS/MS Chromatogram of TFV and FTC in Patient’s Plasma Extract. Peak Areas: TFV, 0.347 X 10⁶; FTC, 21.4 X 10⁶
Figure 2(D). LC/MS/MS Chromatograms of TFVand FTC in a Low Spiked Plasma (10 ng/mL) and a Blank Plasma (overlaid).