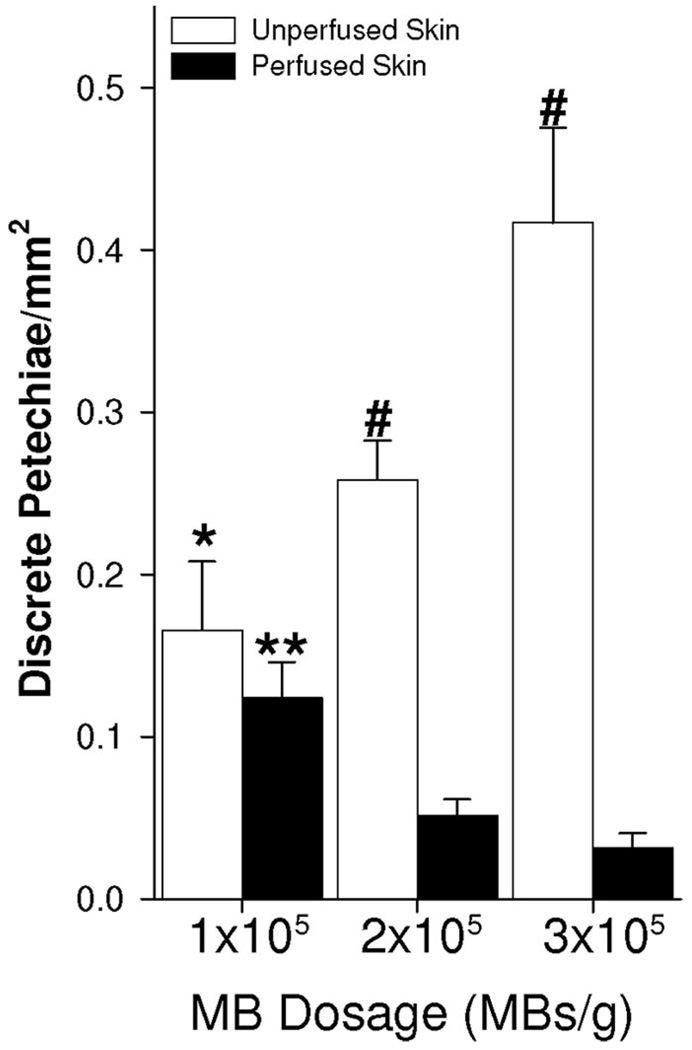
FIGURE 5.
Bar graph illustrating petechiae bioeffects/mm2 during continuous injection of MBs at 1 × 10⁵, 2 × 10⁵, and 3 × 10⁵ MBs/g over a period of 12 minutes. *Significantly different (P < 0.05) than unperfused group at 3 × 10⁵ MBs/g. **Significantly different (P < 0.05) than perfused group at 2 × 10⁵ and 3 × 10⁵ MBs/g. #Significantly different (P < 0.05) than perfused group at same MB dosage.

