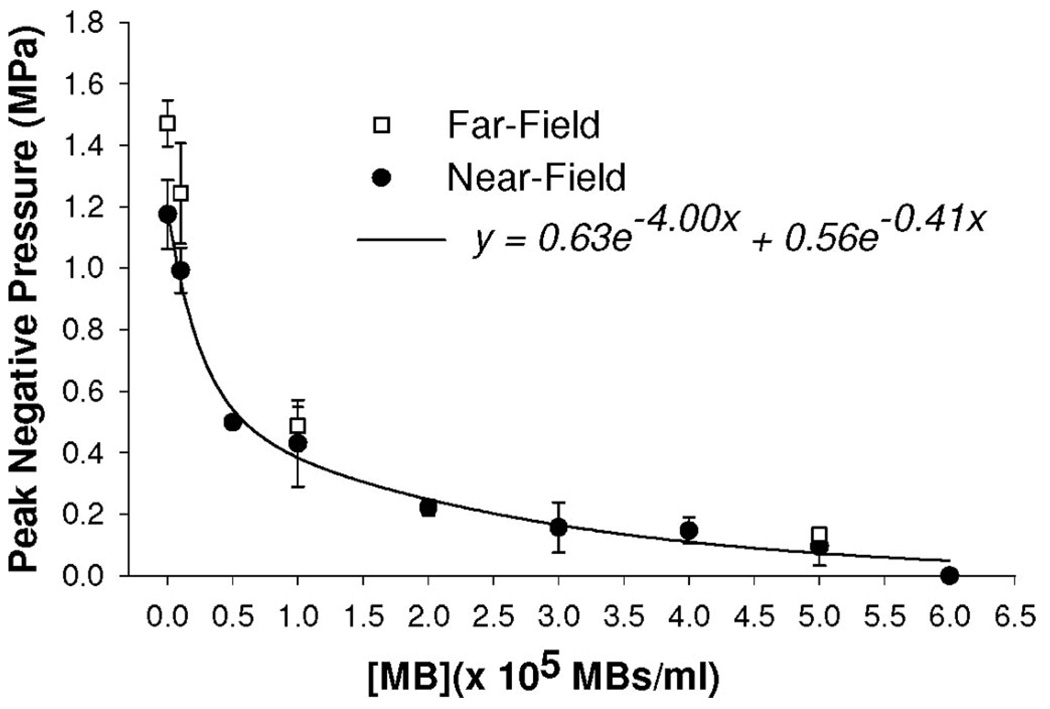
FIGURE 6.
Hydrophone measurements showing the mean peak-negative pressure of ultrasound transmitted through solutions containing MBs at various concentrations. Data are means ± standard deviation. Each data point is the mean of between 3 and 5 separate trials. Near-field data are fit with an exponential decay regression.

