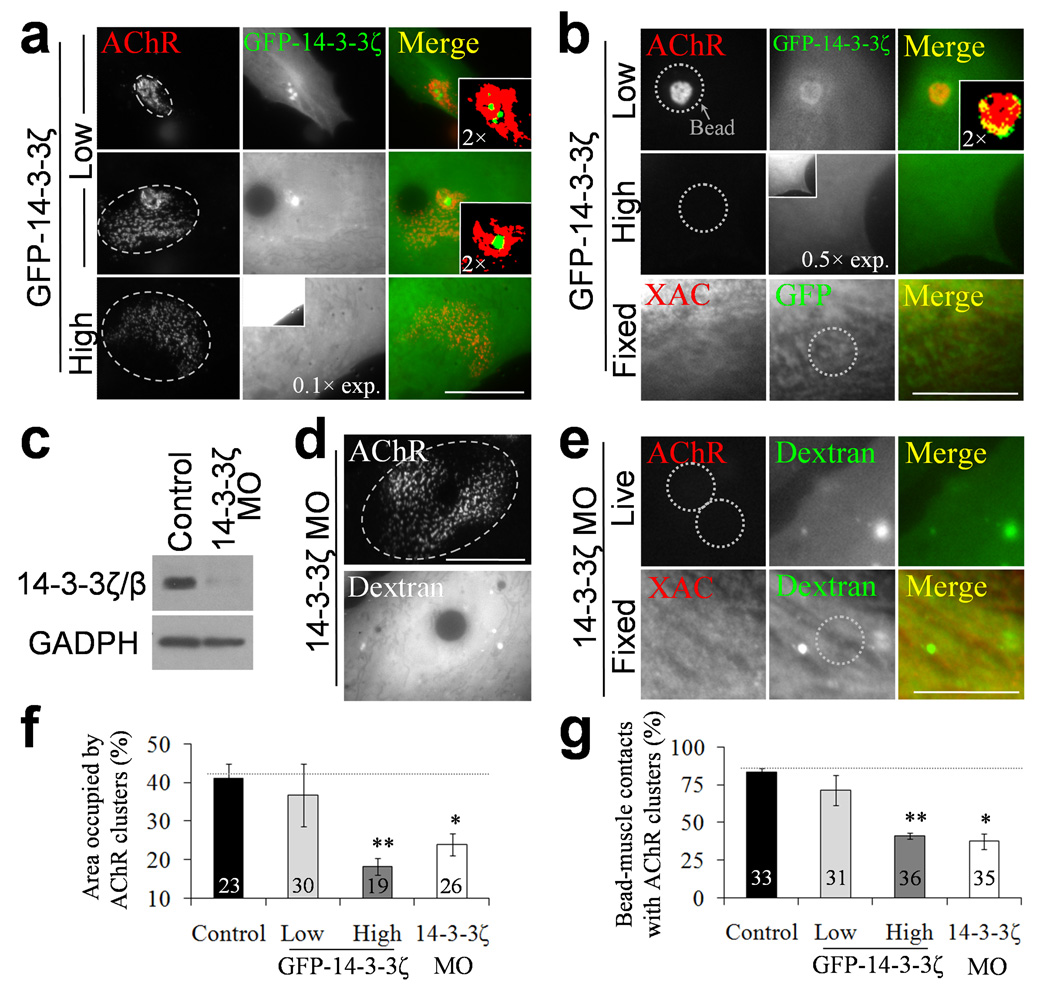
Figure 7. Involvement of 14-3-3ζ in AChR clustering and ADF/cofilin localization. (a, b).
Representative sets of images showing the effects of different over-expression levels of GFP-14-3-3ζ on spontaneous (a) and agrin bead-induced (b) AChR clusters. Please note that the images of high GFP-14-3-3ζ expressing cells were taken using a reduced exposure to allow the examination of subcellular localization. The insets represent the images of the same cells, but acquired using the same exposure as that for cells expressing a low level of GFP-14-3-3ζ. One thus can appreciate the huge difference in the expression level of GFP-14-3-3ζ between these two groups. The magnified regions were pseudo-colored after an intensity threshold to show the differential localization of GFP-14-3-3ζ and AChRs (color insets). XAC immunostaining was performed in GFP-14-3-3ζ-expressed muscle cells stimulated with agrin beads. (c) Western blotting analysis on the 14-3-3ζ/β protein levels in the 14-3-3ζ morpholino (MO) knockdown experiment with GADPH as a loading control. Full-length blots are presented in Supplementary Fig. 12. (d) A similar disorganization of the spontaneous AChR clusters cultured from 14-3-3ζ morpholino embryos, as identified by fluorescent dextran signals. Ellipses (a, d) were drawn to outline the periphery of AChR clusters for the quantitative analysis in panel f. (e) A representative set of images showing the effects of 14-3-3ζ morpholino on AChR clustering and XAC localization induced by agrin beads. (f, g) Quantifications of spontaneous (f) and agrin bead-induced (g) AChR clusters in response to 14-3-3ζ over-expression or morpholino knockdown. Numbers indicate the number of samples counted from 2 independent experiments. Asterisks indicate significant differences (t-test, * p < 0.005; ** p < 0.001). Scale bars: 20 µm (a, d); 10 µm (b, e). Error bars in (f) and (g) represent s.e.m.

