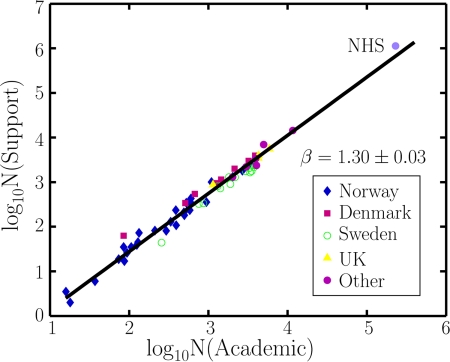
Fig. 1.
Diagram showing the distribution of academic and support staff for Scandinavian and a few other research units, including 4 U.K. universities. The data in this log-log plot were fitted to a power law, using an orthogonal distance regression. We used simple bootstrap sampling with repetition to seek the spread in the data and found a close to Gaussian distribution in the values for the exponents. Confidence intervals on the slopes were estimated using bootstrapping. Slopes for individual data sets (with confidence intervals): Norway, 1.32 (1.24–1.40); Denmark, 1.34 (1.19–1.39); Sweden, 1.39 (1.07–1.51). The analyses were carried out in Past, version 1.89, Hammer et al. (6). Sources of data: Norwegian data (from around 1990) can all be found in the database for the statistics of higher education in Norway (http://dbh.nsd.uib.no/dbhvev/ansatte/tilsatte_rapport.cfm). Data for the University of Oslo from before 1990 are available from annual reports. Data from Swedish, Danish, and other research units are found at the individual university's web pages, usually with references to the respective annual reports. The National Health Service (NHS) data are published at http://www.ic.nhs.uk/pubs/nhsstaff. No data have been excluded from the diagram. All data are provided in Tables S1 and S2.

