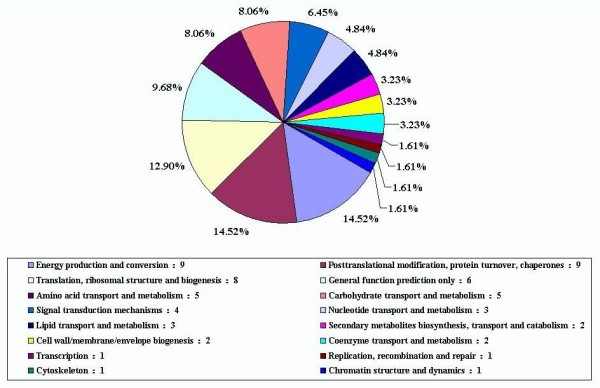
Figure 4.

The COG categories of drought-tolerance gene in cotton. The drought-related gene sets differ in their distribution of COG categories (E-value < 1e-05). The pie chart is color-coded as per COG colors with the COG functional annotation, and represented the percentages of genes per COG category.
