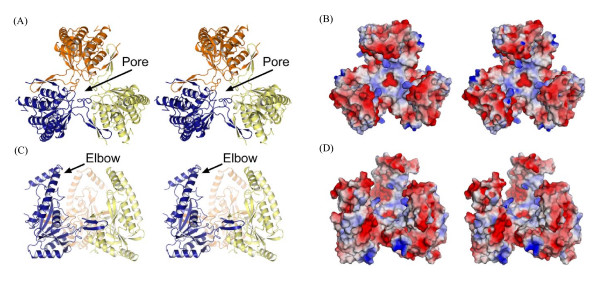
Figure 3.
Stereo image of ASP1 trimer. (A) and (C) Orthoganol views of ASP1 trimer shown in ribbon. Individual subunits are colored, yellow, blue and orange. (B) and (D) Surface representations corresponding to views of ASP1 in (A) and (C), respectively. Positive and negative electrostatic potential are indicated in blue and red surface, respectively.

