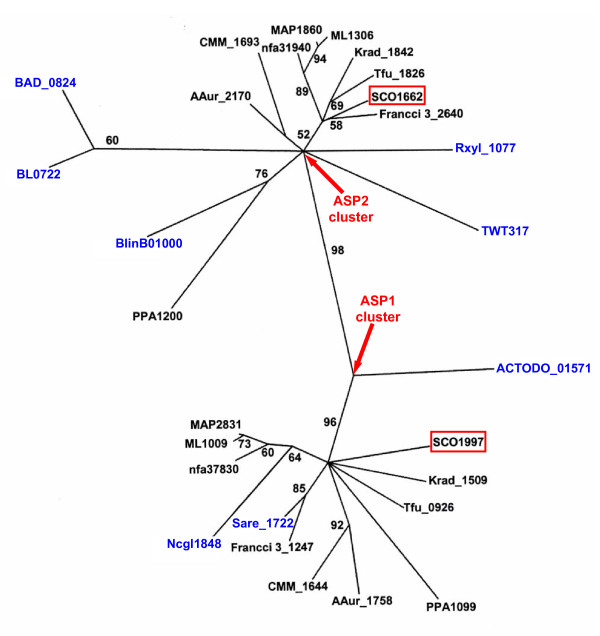
Figure 8.
Phylogenetic tree of ASP1 and ASP2 homologous genes in different actinobacterial species. The gene ID in blue are from these genomes which only contain one of the two paralogous genes. The representing genomes of each gene ID are listed in Additional file 2. The bootstrap scores >50% are indicated on various branch points.

