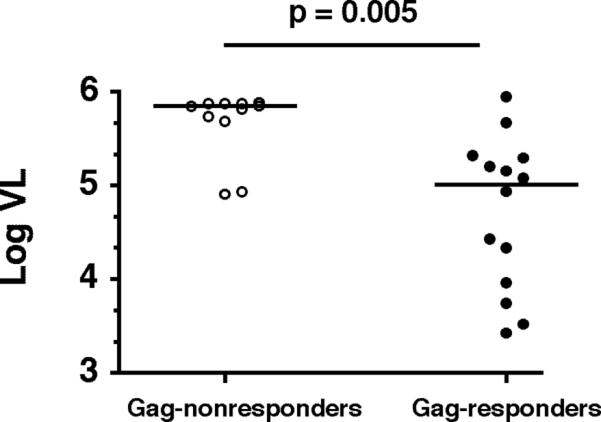
FIGURE 5. Responders to HIV-1 Gag exhibit lower viral loads.

Subjects with Gag-specific T cell responses (n=14, median VL=703,000 copies/ml) had significantly lower viral loads than Gag-nonresponders (n=11, median VL=102,090 copies/ml; p=0.005). Bars indicate median values.
