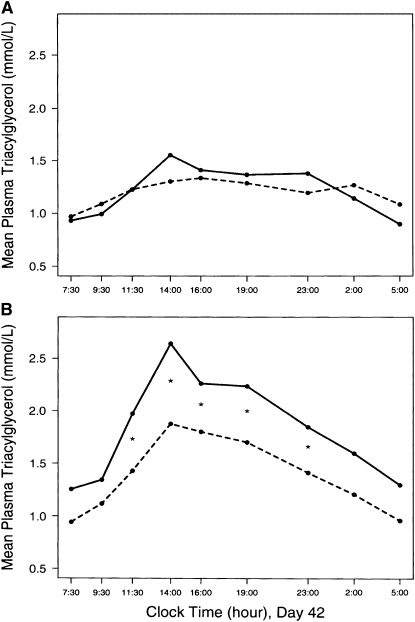
FIGURE 2 .
Mean plasma triacylglycerol (triglyceride) concentrations in 12 healthy women (A) and 12 healthy men (B) during the 24-h metabolic profiles on d 42 of the fructose (solid line) and glucose (dashed line) diets from 07:30 to 14:00; *significant difference between the 2 points, P < 0.006 (0.05/9, Bonferroni adjustment for multiple comparisons). To convert triglycerides to mg/dL, multiply by 88.5. Reproduced from Bantle et al. (28) with permission.

