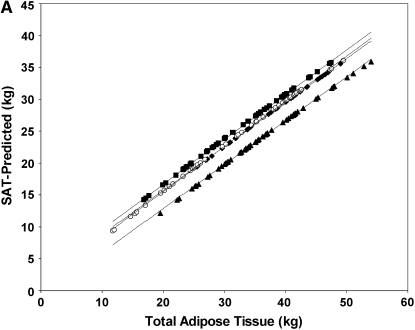
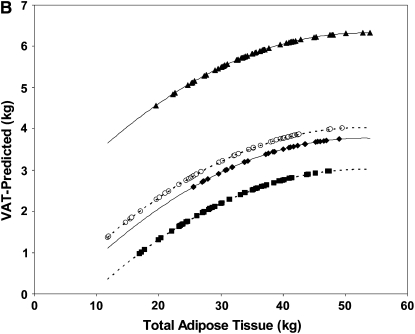
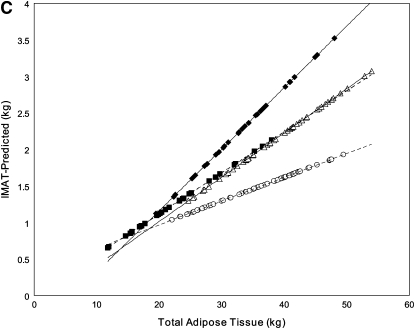
FIGURE 1.
Linear regression model–derived curves for sex-, age-, and height-adjusted subcutaneous adipose tissue (SAT; A), visceral adipose tissue (VAT; B), and intermuscular adipose tissue (IMAT; C) over a range of total adipose tissue for subjects with type 2 diabetes mellitus (T2DM) and control subjects. A and B: T2DM (solid lines: ♦, African Americans; ▴, whites) and control (dashed lines: ▪, African Americans; ○, whites) subjects. C: T2DM (solid lines: ▵, women; ♦, men) and control (dashed lines: ○, women; ▪, men) subjects. A: The SEM of the adjusted mean value was 0.3 kg for African Americans with T2DM (n = 31), 0.2 kg for whites with T2DM (n = 63), 0.2 kg for African American control subjects (n = 48), and 0.2 kg for white control subjects (n = 45). SAT was lower in the T2DM group than in the control group, for both African Americans (P < 0.001) and whites (P < 0.001); however, the difference between the T2DM and control groups was significantly larger in the white subjects (P = 0.003). B: The SEM of the adjusted mean value was 0.2 kg for African Americans with T2DM (n = 31), 0.2 kg for whites with T2DM (n = 60), 0.2 kg for African American control subjects (n = 48), and 0.2 kg for white control subjects (n = 45). VAT was greater in the T2DM group than in the control group for both African Americans (P = 0.011) and whites (P < 0.001), but the difference was greater in whites than in African Americans (P for interaction < 0.001). C: The SEM of the adjusted mean value was 0.09 kg for women with T2DM (n = 54), 0.12 kg for men with T2DM (n = 35), 0.08 kg for control women (n = 64), and 0.13 kg for control men (n = 29). Both men and women had more IMAT with greater amounts of TAT, and the amount increased in men more rapidly than in women (β = 0.059 ± 0.011 and β = 0.027 ± 0.009, respectively; both P < 0.001; P for interaction with TAT = 0.004). At the mean value of covariates in the sample, men had more IMAT than did women (P < 0.001).


