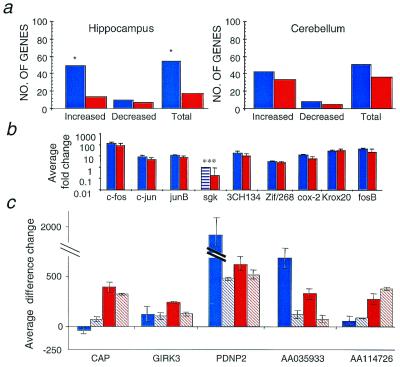
Figure 3.
Gene expression changes in response to pentylenetetrazol-induced seizure. (a) The total number of genes that were increased and decreased in response to seizure in C57BL/6 (blue) and 129SvEv (red) hippocampus and cerebellum. (b) Average fold change values for immediate-early genes in C57BL/6 (blue) and 129SvEv (red) hippocampus. The y axis is a log scale. Hatch indicates decreased expression. (c) Baseline (filled boxes) and seizure-induced hybridization signal (hatched boxes) for C57BL/6 (blue) and 129SvEv (red) hippocampus. Error bars indicate standard error. *, P < 0.001; ***, P < 0.04 using a χ2 test.

