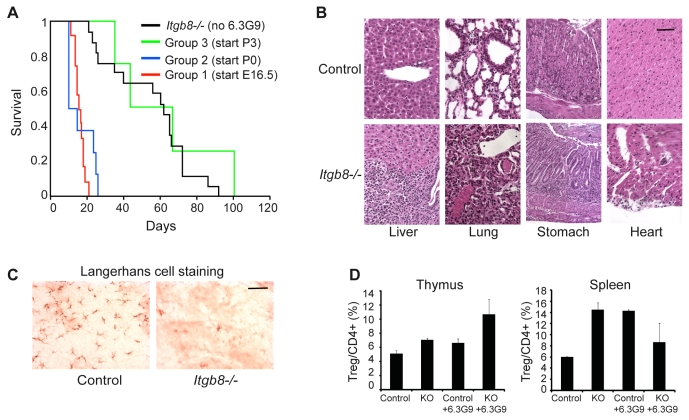
Fig. 3.
(A) Kaplan-Meier survival curves for Itgb8–/– mice (n=17), Itgb8–/– mice with 6.3G9 treatment starting at P3 (n=4), Itgb8–/– mice with 6.3G9 treatment starting at P0 (n=8), and Itgb8–/– mice with 6.3G9 treatment starting at E16.5 (n=12). (B) Hematoxylin and eosin staining of liver, lung, stomach and heart of representative Itgb8–/– and littermate non-KO control mice treated with 6.3G9 starting at E16.5 and sacrificed at 19 days. (C) Itgb8–/– mice treated with 6.3G9 starting at E16.5 lack Langerhans cells (LCs). Representative examples of epidermal sheets stained with an antibody that recognizes LCs. (D) Tregs isolated from thymus and spleen were identified by staining for FOXP3. Cells are from control mice, Itgb8–/– mice, and control and Itgb8–/– mice treated with 6.3G9 starting at E16.5. (n=3-4 for thymus, n=3 for spleen). Error bars represent the s.e.m. Scale bar: 100 μm.

