Fig. 6.
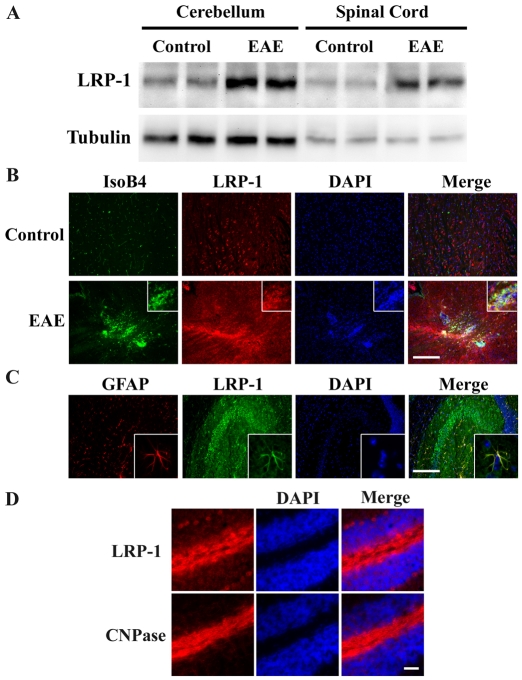
LRP1 expression in EAE. (A) Protein extracts of the cerebellum and spinal cord of mice that were treated to induce EAE, and from control mice, were subjected to immunoblot analysis to detect LRP1, using the LRP1 β-chain-specific antibody, 11H4. The same blots were also probed to detect tubulin as a control for loading. (B) Sagittal brain section from mice with EAE, and control mice, were stained to detect the microglia/macrophage marker, IsoB4 (green) and LRP1 (red). Equivalent regions of the brains of control and EAE mice are shown. The insets show a macrophage/microglial cell infiltrate at higher magnification. Scale bar, 200 μm. (C) Sagittal brain section were immunostained to detect astrocytes (GFAP, red) and LRP1 (green). Images of the hippocampus are shown. The insets show astrocytes that are immmunopositive for both GFAP and LRP1. Scale bar, 200 μm. (D) Sequential sagittal brain sections were immunostained for oligodendrocytes (CNPase) and LRP1. Scale bar: 50 μm.

