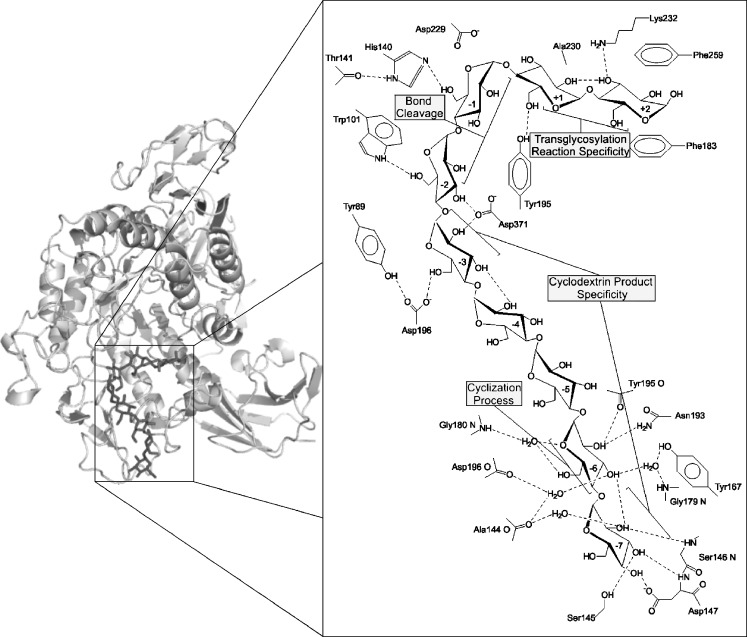
Fig. 6.
Structural representation of BC251 CGTase protein, with a maltononaose substrate bound at the –7 to +2 subsites (Protein Data Bank 1CXK). The side panel displays a close-up view of the catalytic core region with schematic representation of the interactions between residues of the nine substrate binding sites of BC251 CGTase and the maltononaose substrate. The major contributions of each subsite for the formation of cyclodextrins have been highlighted. This side panel has been adapted from Uitdehaag et al. (1999a) and was created using PyMOL (http://www.pymol.org)

