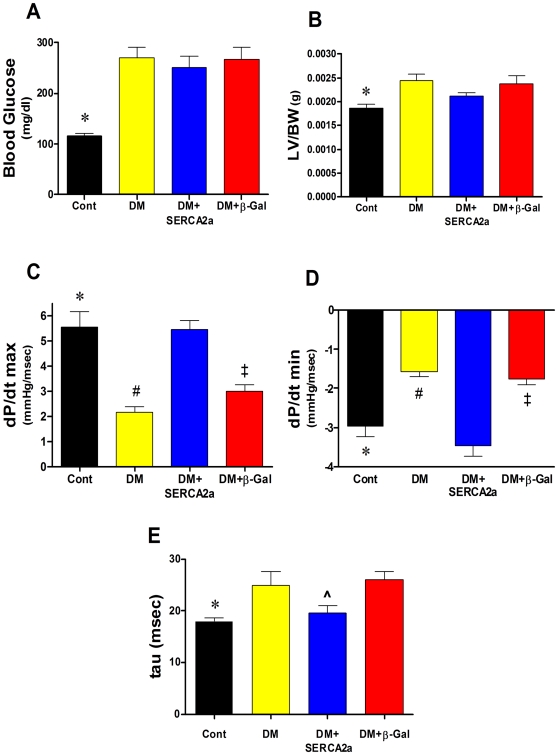
Figure 1. Cardiac structural and functional parameters in the different experimental animal groups.
(A) Blood glucose levels. Diabetes (DM) induced a sharp increase in glucose levels which remained high even after viral infection with SERCA2a and β-gal transgenes. (B) LV/BW ratio calculated based on the LV weight and the final weight of the animal (prior to death). Changes in contractility (dP/dt max) (C), in relaxation (dP/dt min) (D) and in tau (E) in the different groups. All data shown as means±SD. LV, left ventricle; BW, body weight. * P<0.05 Control vs. DM; # P<0.01 DM vs. DM+SERCA; ‡ P<0.05 DM+β-Gal vs. DM+SERCA; ^ P = 0.04 DM+SERCA vs. DM+β-Gal.

