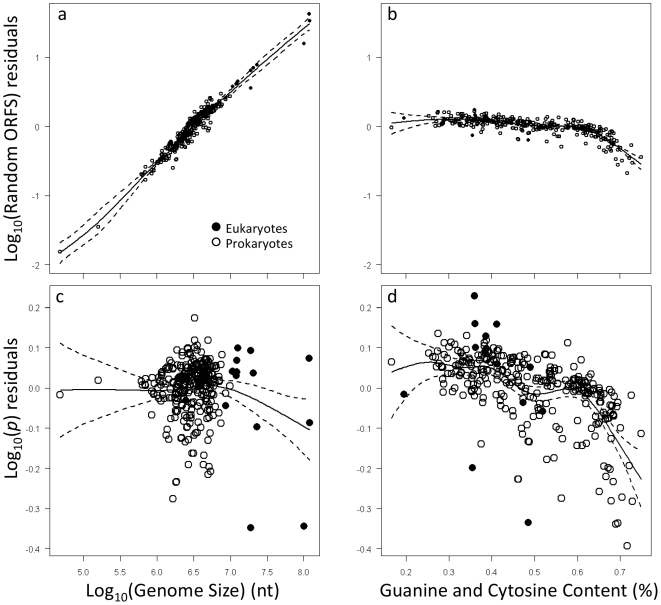
Figure 3. The relationship between ORFs and genome characteristics.
Panels a and b: show the relationships between the total number of random ORFs versus genome size and GC content. Panels c and d: Show the relationships between the fraction of all ORFs that are randomly generated (p in Eqs. 1–2) versus genome size and GC content. Data were fitted using generalized additive models with non-parametric smoothing functions. Dashed lines represent 95% point wise confidence intervals.

