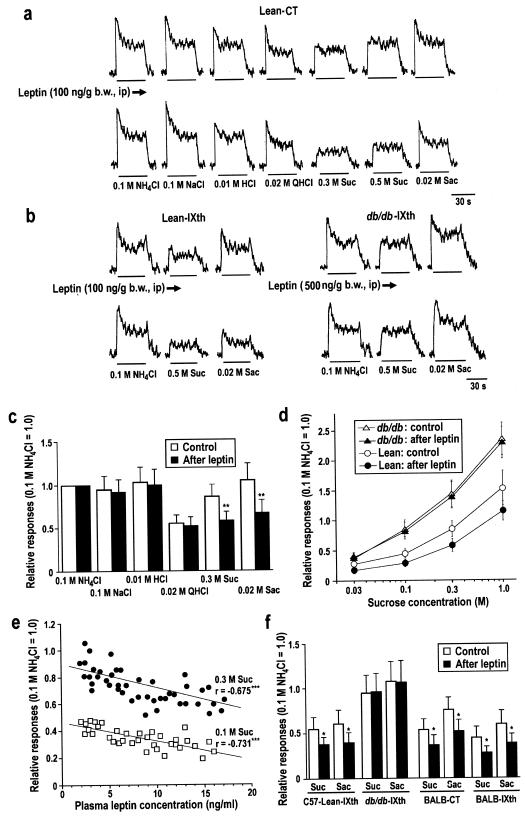
Figure 1.
(a) Sample recordings of integrated responses of the CT nerve to 0.1 M NH4Cl, 0.1 M NaCl, 0.01 M HCl, 0.02 M QHCl, 0.3 M sucrose (Suc), 0.5 M Suc, and 0.02 M Sac before (Upper) and after (Lower) i.p. injection of leptin in control lean mice. (b) Responses of the IXth nerve to 0.1 M NH4Cl, 0.5 Suc, and 0.02 M Sac before (Upper) and after (Lower) leptin in lean and db/db mice. (c) Response profiles to six taste stimuli before (Control) and after leptin (100 ng/g of b.w.) (n = 16–20). (d) Concentration-response relationships for sucrose before and after leptin in lean control (n = 12) and db/db mice (n = 8). Doses of leptin were 100 ng/g of b.w. for control and 500 ng/g of b.w. for db/db mice. (e) Relative responses to 0.1 or 0.3 M Suc of lean mice (n = 43 or 36) were plotted as a function of their plasma leptin levels (ng/ml). ***, t test, P < 0.001. (f) Responses to 0.5 M Suc and 0.02 M Sac before and after leptin (100 ng/g of b.w.) in the IXth nerve of C57BL lean (n = 7) and db/db (n = 5) mice, and CT (n = 8) and IXth nerve (n = 6) of lean BALB mice. *, t test, P < 0.05.

