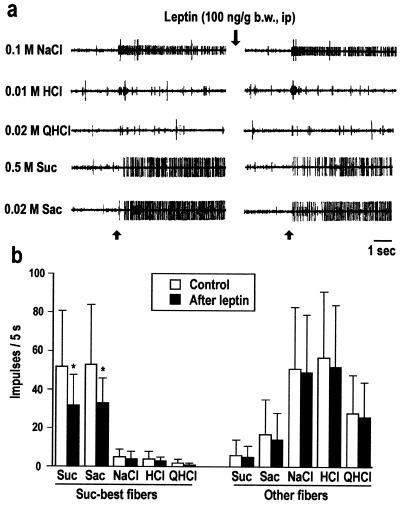
Figure 2.
(a) Sample recordings of two single CT fibers (one small and one large) in response to 0.1 M NaCl, 0.01 M HCl, 0.02 M QHCl, 0.5 M Suc, and 0.02 M Sac before and after leptin (100 ng/g of b.w.) in lean C57BL mice. In the large unit (Suc-best fiber), responses to sucrose and saccharin decreased after leptin, whereas the small unit (NaCl-best fiber) showed no such leptin inhibition. (b) Response profiles to 0.5 M Suc, 0.02 M Sac, 0.1 M NaCl, 0.01 M HCl, and 0.02 M QHCl before (control) and after leptin in two groups of fibers, classified whether they would respond best to sucrose among four basic taste stimuli (Suc-best fibers, n = 9) or not (other fibers, n = 21). *, t test, P < 0.05.

