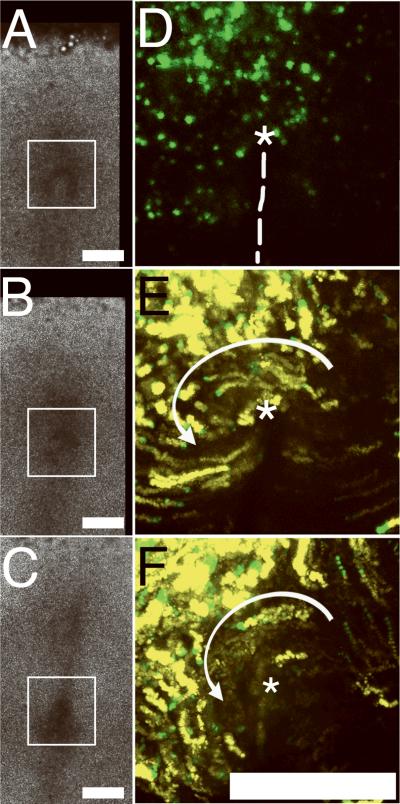
Figure 1. Whole-mounted chicken embryos subjected to time-lapse imaging after H2B-GFP electroporation.
A-C. Three brightfield image frames extracted from a 360 min time-lapse sequence (Movie 1) demonstrate the extensive degree of tissue-level motion and expansion around a region of interest (ROI; white box), which is centered on Hensen's node, at HH stages 4-6. The brightfield Movie 1 is a collage composed of six image frames (2×3) blended into a single wide-field view using TiLa-KUMC software.
D. A corresponding H2B-GFP epifluorescence image within the ROI. The node (asterisk) and the presumptive anterior-posterior axis (dashed line) are indicated. The epifluorescence image depicts one 10X image field.
E and F. Epifluorescence cellular tracking within the same ROI as Panels A-C demonstrate the counter-clockwise vortical motion of some nodal tissue indicated by the white arrow (see corresponding Movie 1). The cellular (nuclear) tracks from 20 consecutive frames are colored yellow and superimposed with the last 5 frames colored green. Simple inspection confirms that the motion pattern within the node is not bilaterally equivalent with respect to the anterior-posterior axis (dashed line in Panel D; see Movies 1 and 2). Magnification bars=250 μm.

