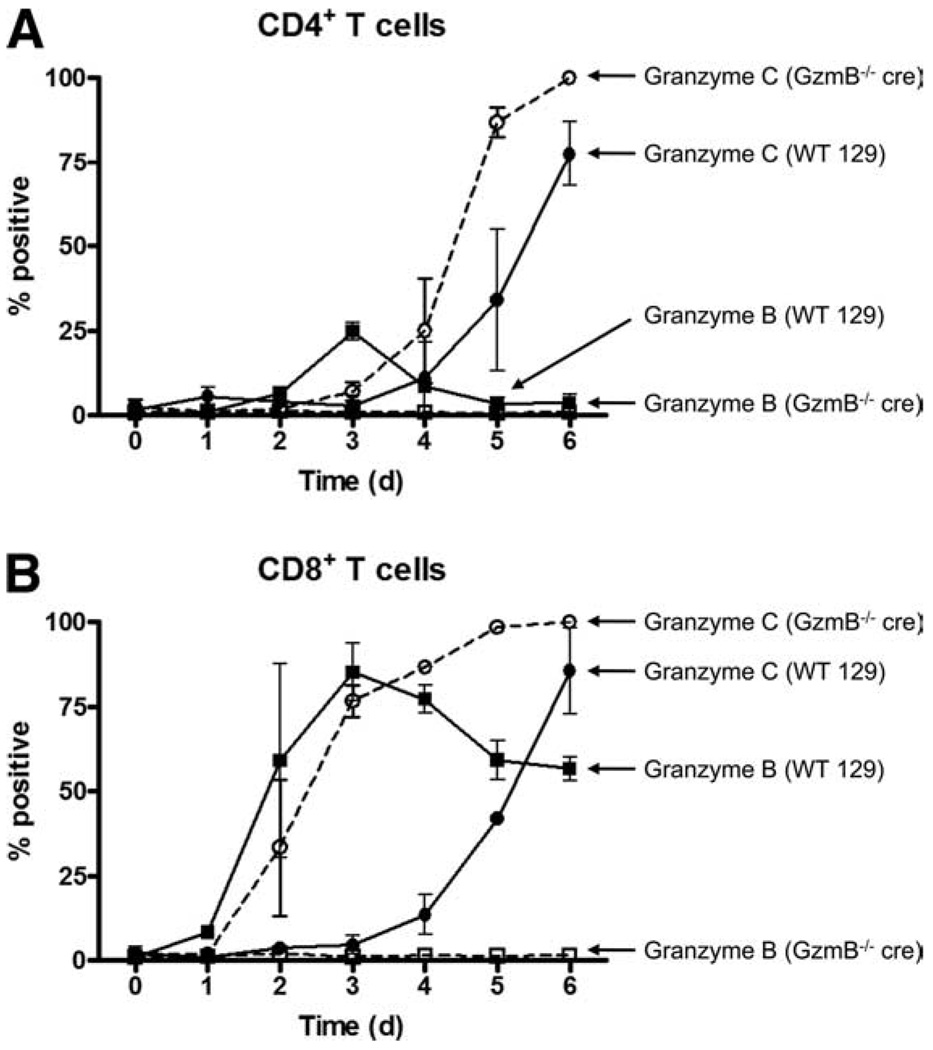
FIGURE 2.
Kinetics of granzyme B and granzyme C protein expression in CD3/CD28-activated T cells. WT and granzyme B−/− cre splenocytes were cultured in K10 medium with CD3/CD28 beads and harvested for flow cytometric analysis at various times during activation. The percentage of CD4+ T cells positive for granzymes B and C is summarized in A and the percentage of CD8+ T cells positive for granzymes B and C is summarized in B. Summary results (mean ± SD) represent pooled data from three independent experiments.

