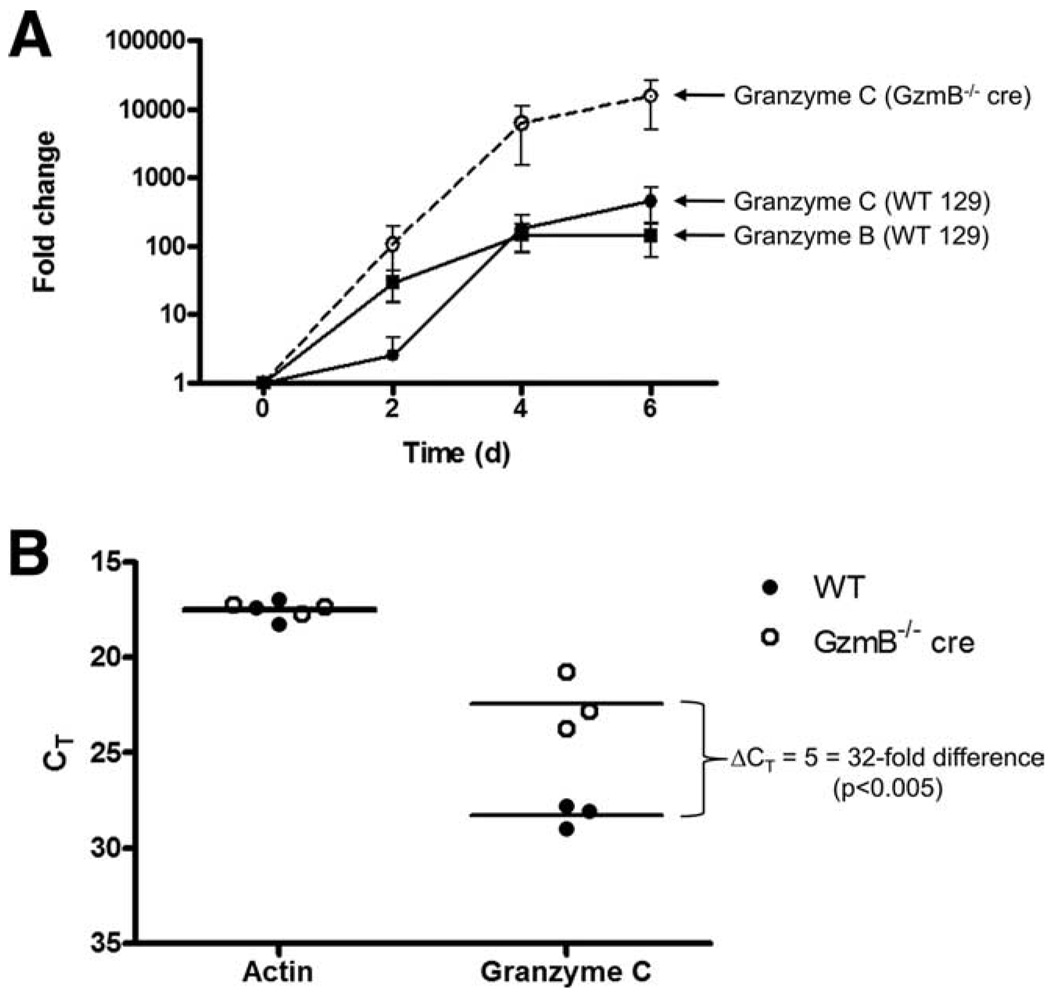
FIGURE 4.
Quantitative real-time RT-PCR comparing WT and granzyme B−/− cre T cell expression of granzyme C mRNA. CD8+ T cells were cultured in K10 medium with CD3/CD28 beads and RNA was harvested for qRT-PCR at various times during activation. The mean ± SEM expression from three independent experiments is shown as fold change of activated compared with naive T cells (A). The comparative Ct method was used and granzyme C expression was normalized to β-actin. Raw threshold cycles for actin and granzyme C mRNA on day 4 are plotted on an inverted scale in B.

