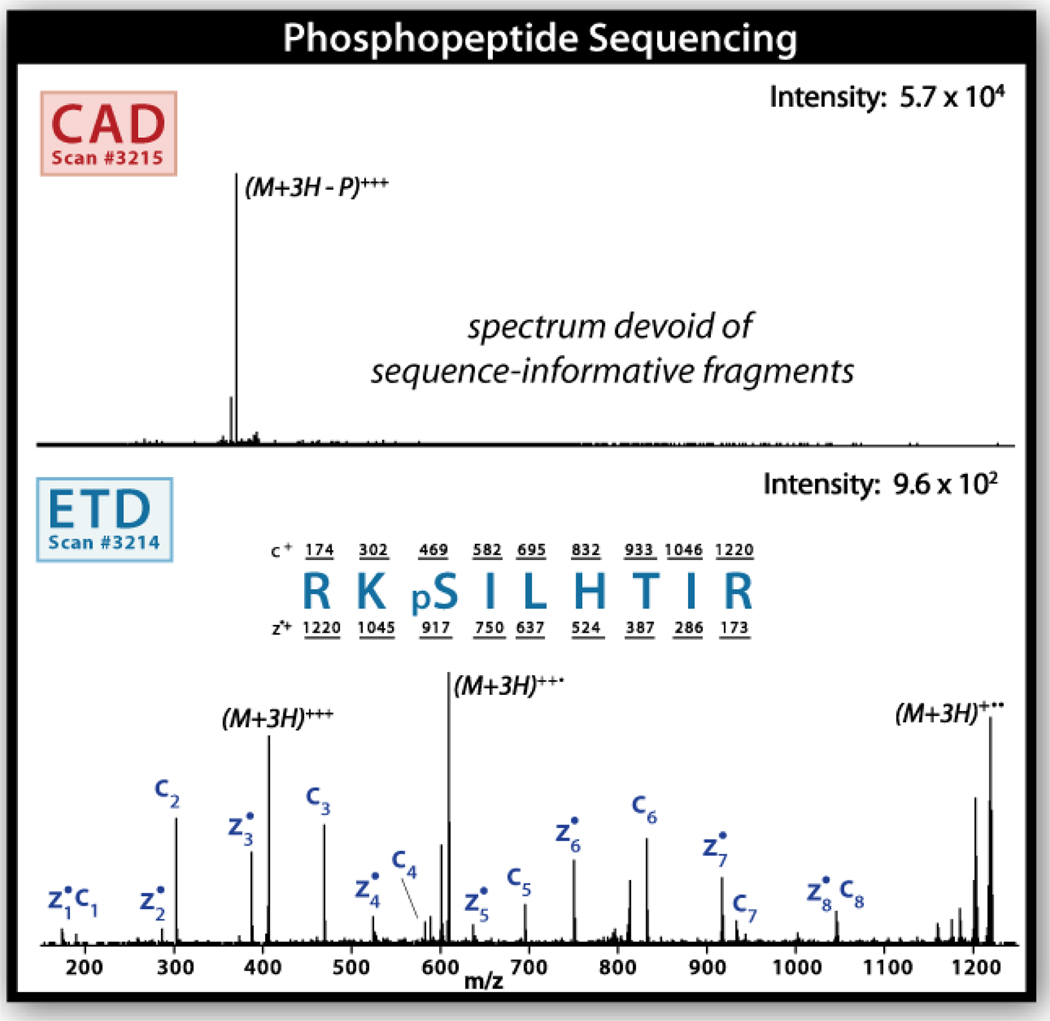
Figure 4.
Tandem mass spectra obtained from a phosphopeptide eluted during a nHPLC-MS/MS experiment. The top panel displays the tandem mass spectrum produced following CAD. Note this spectrum is dominated by a single m/z corresponding to loss of a phosphoric acid moiety. No peptide backbone cleavage is observed. Sequence identification is impossible. The lower panel displays the tandem mass spectrum that is produced following ETD fragmentation. Here every single backbone cleavage product is observed. The sequence is easily assigned as RKpSILHTIR. Both panels display single-scan mass spectra.

