
Figure 5.
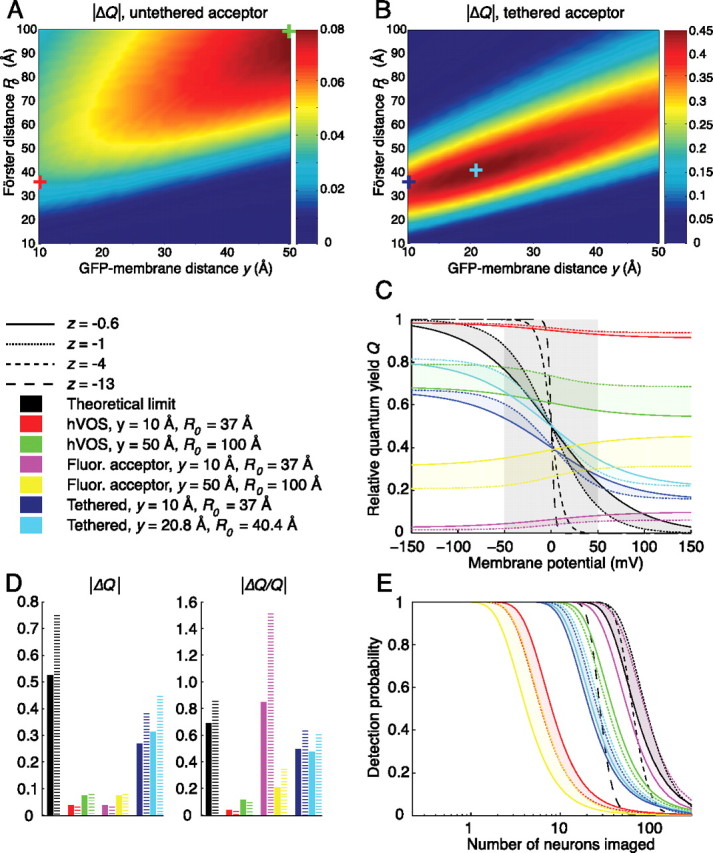
Theoretical performance limits and future optimization of hVOS. A, Predicted |ΔQ| per 100 mV for hVOS at an acceptor density of 1300 molecules/μm2, |z| = 1. The DPA/EGFP-ΔCAAX pair (y = 10 Å; R0 = 37 Å) yields a |ΔQ| of 0.03 (red cross), whereas the optimal values tested (y = 50 Å; R0 = 100 Å) yield a |ΔQ| of 0.08 (green cross). Note that low values of y are optimal for realistic values of R0, whereas large y is optimal for very large values of R0. B, Predicted |ΔQ| per 100 mV for the tethered acceptor configuration, in which the FRET acceptor is covalently linked to the GFP, at a density of 1300 molecules/μm2, |z| = 1. For tethered-DPA/EGFP-ΔCAAX (y = 10 Å; R0 = 37 Å), the |ΔQ| is 0.38 (blue cross), whereas the optimal values tested (y = 20.8 Å; R0 = 40.4 Å) yield a |ΔQ| of 0.48 (cyan cross). Note that optimal |ΔQ| is attained near experimentally realistic values of y and R0. C, Relative quantum yield Q, as a function of Vm − V0, at a maximum induced capacitance of 0.2 μF/cm2. The shaded gray box denotes the 100 mV window producing maximum |ΔQ|. The theoretical limit of |ΔQ| increases significantly with increasing |z| (black lines). Values of Q calculated at |z| = 0.6 (solid line) and |z| = 1 (dotted line) represent bounds on optimal values of Q for monovalent anions such as DPA, whereas larger values of |z| (dashed lines) represent upper bounds on |ΔQ| for reporters with cooperative charge movement, such as GFP-ion channel fusions. The ideal hVOS (y = 50 Å; R0 = 100 Å) yields a modestly increased |ΔQ| (green vs red), whereas the tethered acceptor configuration produces much larger increases in |ΔQ| (blue and cyan). The use of fluorescent FRET acceptor molecules does not change |ΔQ| (magenta and yellow). D, |ΔQ| and |ΔQ/Q| for the three configurations are compared with theoretical limits with |z| = 0.6 (solid black bars) or |z| = 1 (dashed black bars). The tethered acceptor configuration (blue and cyan bars) produces much larger |ΔQ| and |ΔQ/Q| than hVOS (green and red bars), whereas the fluorescent acceptor configuration (magenta and yellow bars) produces identical |ΔQ| with much larger |ΔQ/Q|. The |ΔQ/Q| for the fluorescent acceptor model is able to surpass the theoretical limit, because its fluorescence increases, rather than decreases, with depolarization (see Results for discussion). E, Probability of action potential detection as a function of number of neurons imaged. Performance of the theoretically optimal voltage reporter improves as |z| increases from 0.6 (solid black line) to 1 (dotted black line) and then deteriorates as |z| increases further (dashed black lines). Despite substantially lower |ΔQ| and |ΔQ/Q|, the ideal hVOS (y = 50 Å; R0 = 100 Å) has better performance than the tethered acceptor model (green vs blue/cyan), caused by greater density of fluorophores, whereas the fluorescent acceptor model (y = 10 Å; R0 = 37 Å) performs near the theoretical limit (magenta vs black).