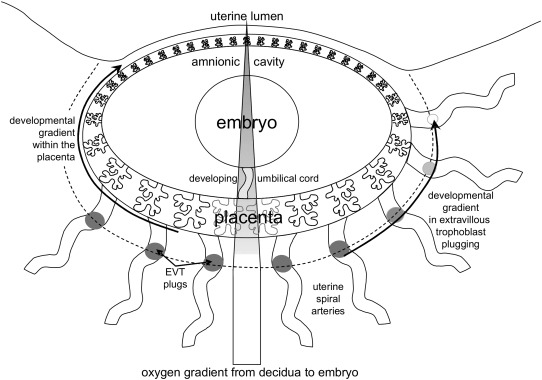
Fig. 2.
Schematic representation of placenta and embryo at about weeks 8–10 of gestation. The embryo rests in its amnionic cavity and is connected to the placenta via the developing umbilical cord. The placenta shows a clear developmental gradient (arrow on the left) with the highest level of development at the site of implantation, i.e. at the embryonic pole. This developmental gradient can be found as well in the extent of extravillous trophoblast plugging of spiral arteries (arrow on the right). The bar in the centre represents the oxygen gradient from the placental bed (pO2 70 mm Hg) to placenta (pO2 < 20 mm Hg) and embryo (pO2 << 20 mm Hg). The dotted line indicates where plugging of spiral arteries generates the oxygen gradient towards the embryo. For further details on the changes at the end of the first trimester see also Figure 2 in Jauniaux et al. (2006) and Figure 4 in Burton (in press).

