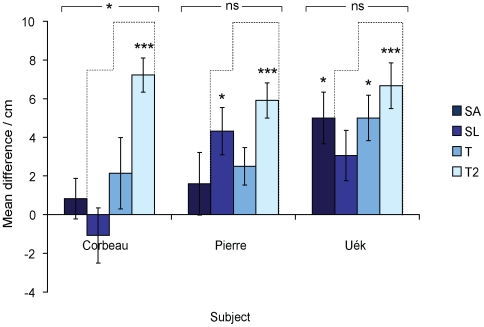
Figure 5. Tool selectivity in Experiment 2.
Bars show the deviation (±SE) between the mean length of the tool first used by crows to probe for food (in experimental conditions) and a hypothesised mean value if subjects were picking out-of-reach tools at random. The dashed line indicates the length deviation necessary to reach the food, i.e. the deviation that would have been shown by a perfect performer. On Secondary-Any (SA) trials any of the four out-of-reach tools is correct so there is no necessary deviation. The line is lower for the Secondary-Long (SL) than for the Tertiary (T, T2) conditions because average tool length expected from random choice is longer (in SL there are four tools to choose from, leading to an expected length of 17.5 cm; in Tertiary trials, one tool is out of reach so the first choice can only be between the other three, leading to an expected length of 15 cm; for further details, see main text). P-values (two-tailed) from one-sample t-tests on the observed and hypothesized means (multiplied by the number of comparisons, c, for each subject; c = 4) are indicated by asterisks above each bar; p-values from Kruskal-Wallis tests are indicated above each subject (* = p<0.05, ** = p<0.01, *** = p<0.001). There was a significant difference in tool length between conditions for Corbeau only: post-hoc tests showed that the tools he used to probe with on Tertiary-2 trials were significantly longer than those used in all other conditions.

