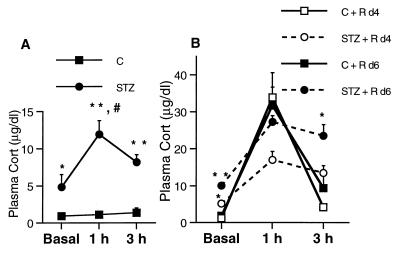
Figure 2.
Plasma Cort levels in control and STZ diabetic animals in resting conditions. Blood samples were collected through tail clipping in less than 30 sec. (A) Control rats showed similar Cort plasma levels at basal, 1-, and 3-h time points. Diabetic rats had increased basal levels of Cort and mounted a stress response that was not shut off by 3 h. #, P < 0.0001 compared with STZ group at the same time point. (B) Plasma Cort time course over 7 d of daily restraint stress of control and STZ diabetic rats. *, P < 0.05 and **, P < 0.001, compared with control group at the same time points. Two-way ANOVA, Tukey post hoc test. Bars represent means + SEM.

