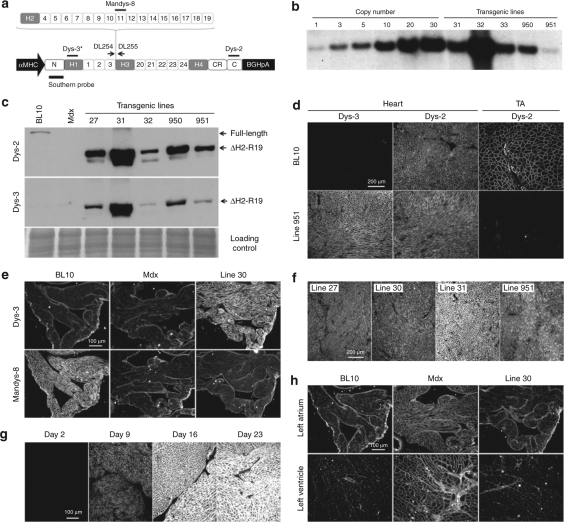
Figure 1.
Characterization of cardiac-specific ΔH2-R19 mini-dystrophin transgenic mice. (a) Schematic outline of the transgenic construct. Dotted lines denote the regions deleted (from H2 to R19) from the full-length gene. The locations of the PCR primers (DL254 and DL255) and the origin of the Southern probe are marked. The regions recognized by Dys-2, Dys-3, and Mandys-8 antibodies are also marked. Asterisk, Dys-3 antibody only recognizes human dystrophin. C, C-terminal domain; CR, cysteine-rich domain; H, hinge; N, N-terminal domain; numerical numbers, spectrin-like repeats. (b) A representative Southern blot result from transgenic lines 31, 32, 33, 950, and 951. (c) A representative heart western blot from BL10, mdx, and transgenic lines 27, 31, 32, 950, and 951. Top panel, Dys-2 antibody reveals both the endogenous full-length mouse dystrophin in the BL10 heart and human mini-dystrophin in transgenic mice; middle panel, Dys-3 antibody only reveals human mini-dystrophin; bottom panel, loading control (rapid blue staining of a duplicate gel). (d) Representative Dys-2 and Dys-3 immunofluorescence staining images of the hearts and the tibialis anterior (TA) muscles from BL10 and transgenic line 951 mice. (e) Representative Dys-3 and Mandys-8 immunofluorescence staining images of the left atrium from BL10, mdx, and transgenic line 30 mice. (f) Representative Dys-3 immunofluorescence staining photomicrographs from transgenic lines 27, 30, 31, and 951. (g) Representative photomicrographs of Dys-2 heart immunofluorescence staining from line 32 at different postnatal development stages. (h) Representative left-heart utrophin immunofluorescence staining images from BL10, mdx, and transgenic line 30 mice. To facilitate the comparison of relative expression levels, images in the same panel were taken under the exact same exposure conditions.

