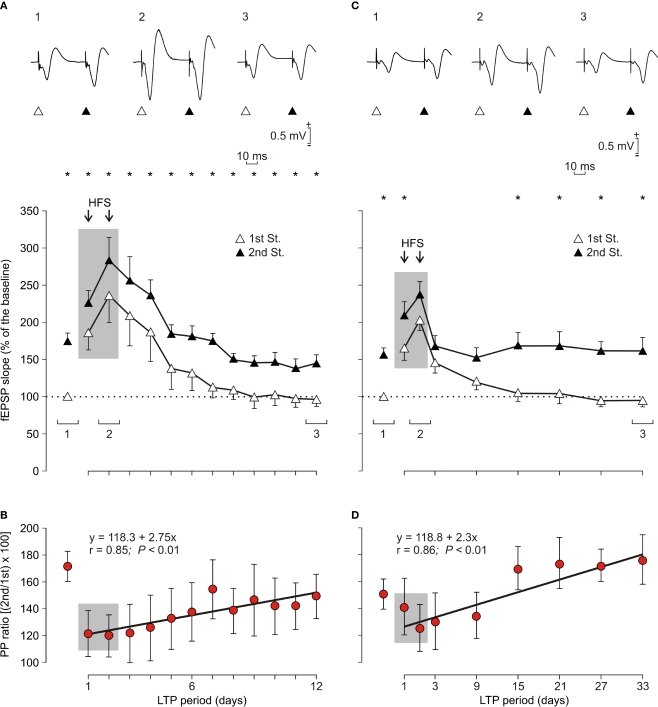
Figure 5.
Evolution of fEPSPs evoked in the CA1 area by paired-pulse stimulation of Schaffer collaterals before and after two HFS sessions. (A, C) For LTP induction, each animal was presented with two HFS sessions (see arrows and shaded area) each consisting of five 200 Hz, 100 ms trains of pulses at a rate of 1/s. This protocol was presented six times, at intervals of 1 min. The 100 μs, square, biphasic pulses used to evoke LTP were applied at the same intensity used for the single pulse presented following HFS presentation. The evolution of LTP was checked using a pair of pulses (1st, white triangles; 2nd, black triangles) with an inter-stimulus interval of 40 ms. Recordings was carried out for 12 days (A, n = 10 animals) and 33 days (C, n = 10 animals). At the top are illustrated some representative examples (averaged three times) of fEPSPs evoked at the CA3-CA1 synapse by paired-pulse stimulation (40 ms interval) collected prior to HFS (1), during the 2nd HFS session (2) and 10 (3, left) and 31 (3, right) days after it. Illustrated data correspond to mean ± SEM. *P < 0.001, for differences between the 1st and 2nd pulses, corresponding to data illustrated in (A) [F(12,108) = 13.463] and (C) [F(8,72) = 25.94]. (B, D) Note that fEPSP slopes decreased across recording days for both 1st and 2nd, but that their relationship, i.e., the paired pulse (PP) ratio [(2nd/1st) × 100; red circles and regression lines] increased steadily across time. Equations corresponding to the linear regression analyses of PP ratios are also indicated for the two sets of data.

