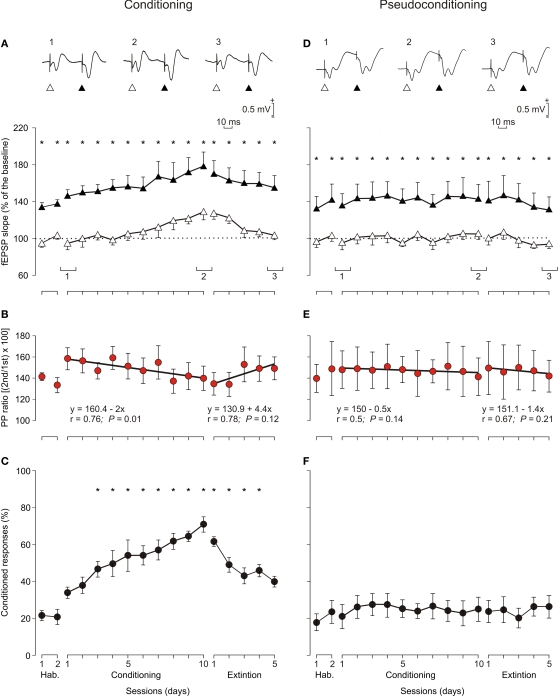
Figure 7.
Learning curves and evolution of fEPSPs evoked by paired-pulse stimulation across the classical conditioning of eyelid responses. (A) Evolution of fEPSPs evoked in the CA1 area by a pair of pulses (1st, white triangles; 2nd, black triangles) at 40 ms interval presented to Schaffer collaterals 300 ms after CS presentation. Illustrated data correspond to mean ± SEM. *P < 0.001, [F(16,144) = 41.443] for significant differences between the 1st and the 2nd pulses. At the top are illustrated some representative examples (averaged three times) of fEPSPs evoked at the CA3-CA1 synapse by paired-pulse stimulation (40 ms interval) collected during the 1st (1) and 10th (2) conditioning sessions and during the 5th (3) extinction session from a conditioned animal. (B) Note that although fEPSPs slopes increased across conditioning and decreased across extinction for both 1st and 2nd pulses (A), their relationship [PP ratio (2nd/1st) × 100; red circles] decreased steadily across training and increased (although not significantly) during extinction sessions. Linear regression analyses of PP ratios are indicated for the two sets of data. (C) Learning curves collected from the same set of animals (n = 10). *P < 0.001, [F(16,144) = 12.46] for significant differences between habituation and conditioning and extinction sessions. (D–F) Similar sets of data collected from pseudoconditioned animals (n = 10). No significant changes where observed for fEPSP slopes (D) [F(16,144) = 0.52; P = 0.93*] and percentage of conditioned responses (F); [F(16,144) = 0.37, P = 0.99] across the successive pseudoconditioning trials.

