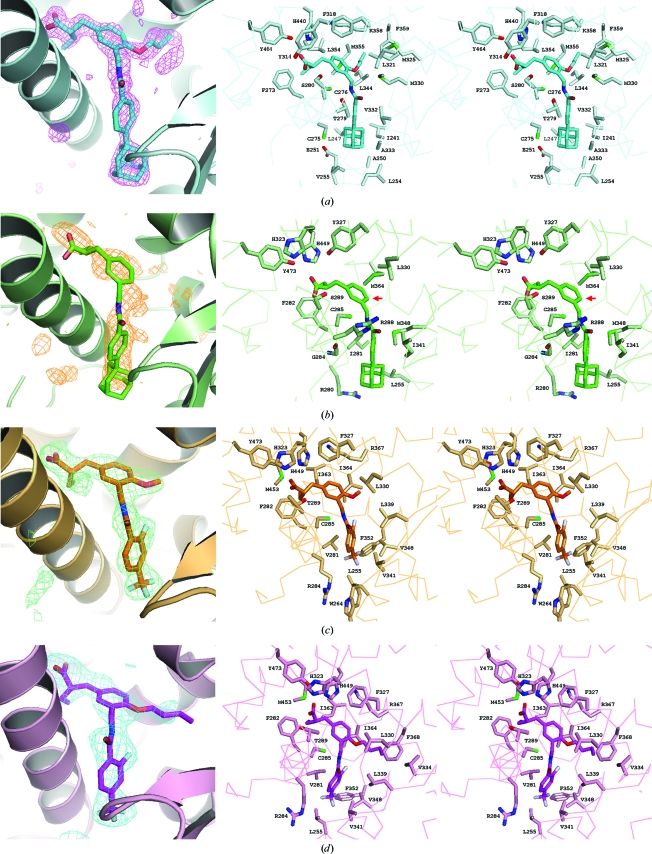
Figure 2.
Close-up views of the ligand-binding pockets. (a) PPARα LBD–TIPP-703. (b) PPARγ LBD–TIPP-703. (c) PPARδ LBD–TIPP-401. (d) PPARδ LBD–TIPP-204. The left column shows the OMIT F o − F c electron-density maps (contoured at 2.2σ) and the right columns show stereoviews of the interaction between the ligand-binding pockets and the bound ligands. The amino-acid residues contacting the ligands are labelled.

