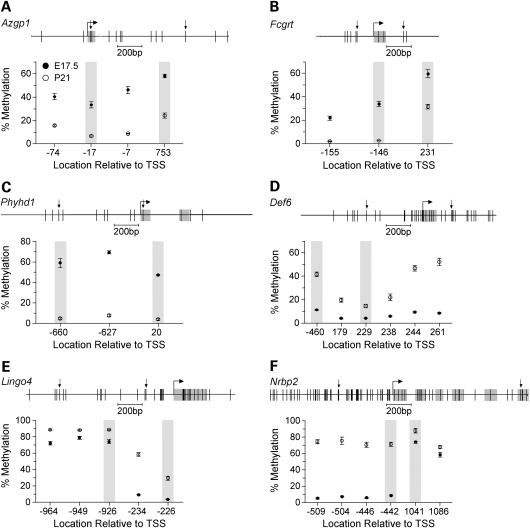
Figure 2.
Detailed analysis of DNA methylation. The upper section of each panel displays the gene region studied by bisulfite sequencing. Vertical lines indicate CpG sites, and downward arrows indicate the boundaries of each informative SmaI/XmaI interval. The lower section of each panel shows percent methylation (Mean ± SEM) versus CpG site location relative to the transcription start site (n = 5 mice per age). Shaded data points indicate the SmaI/XmaI sites that were informative by MCAM. (A) Azgp1. (B) Fcgrt. (C) Phyhd1. (D) Def6. (E) Lingo4. (F) Nrbp2.

