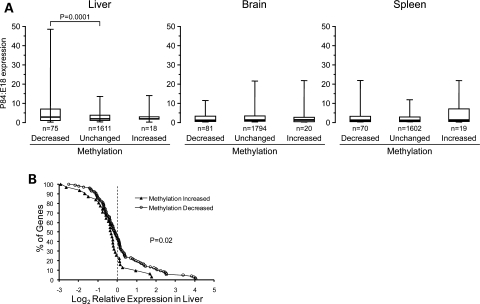
Figure 6.
Association of gene expression with postnatal methylation changes. (A) Box plots of P84:E18 expression ratio in liver, brain and spleen of genes that lost or gained methylation from E17.5 to P21, compared with those in which methylation did not change. Each box plot depicts the median (thick line), 25th–75th percentiles (box) and 5th–95th percentiles of the distribution (whiskers). Among genes that lost methylation in liver from E17.5 to P21, the expression increase from E18 to P84 is greater than that of the reference group, specifically in liver. (B) Distribution of expression Z score in liver versus 36 other tissues among genes that either gained or lost methylation from E17.5 to P21. Genes that lost methylation during early postnatal development are generally expressed at higher levels in liver.

