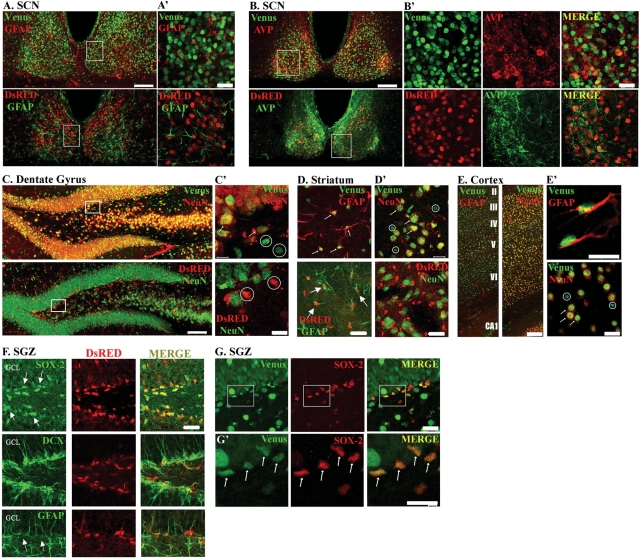
Figure 5.
Distinct mPer1-Venus and mPer2-DsRED expression patterns. (A, B) Double-labeling for Venus or DsRED and (A) the glial marker glial fibrillary acidic protein (GFAP) or (B) the neuronal marker arginine vasopressin (AVP) in the suprachiasmatic nuclei of mPer1-Venus or mPer2-DsRED single transgenic mice. Scale bar = 100 µm. (A', B') Higher magnification images of the boxed regions in (A, B). Scale bar = 20 µm. (C) Double-labeling for Venus or DsRED and the neuronal marker NeuN in the dentate gyrus. Scale bar = 100 µm. (C') Higher magnification images of the boxed regions in (C). Scale bar = 10 µm. (D, D') Double-labeling for Venus or DsRED and (D) GFAP or (D') NeuN in the striatum. Scale bar = 20 µm. (E) Double-labeling for Venus and GFAP or NeuN in the cortex. Roman numerals denote mouse cortical cell layers. Scale bar = 100 µm. (E') Higher magnification images of (E). Scale bar = 10 µm. For (C'–E'), arrows indicate co-localized expression, whereas circles indicate lack of co-localization (F) mPer2-DsRED expression in the subgranular zone (SGZ) of the dentate gyrus. Top panels: Within the SGZ (arrows), mPer2-DsRED expression was observed in SOX-2-positive progenitor cells. Scale bar = 30 µm. Middle panels: Tissue was labeled for doublecortin (DCX) and DsRED. The merged image indicates that the nuclear DsRED signal was not localized to doublecortin-positive neuronal precursor cell nuclei. Bottom panels: mPer2-DsRED expression was observed in GFAP-positive cells in the SGZ. GCL: granule cell layer. (G) Venus expression in SOX-2 progenitor cells of SGZ. Top panels: mPer1-Venus expression was detected in SOX-2-positive progenitor cells. Scale bar = 20 µm. (G') Higher magnification images of the boxed regions in (G). Arrows denote double-labeled progenitor cells. Scale bar = 10 µm. All animals were sacrificed between ZT 11–12 and images were captured by confocal microscopy.

