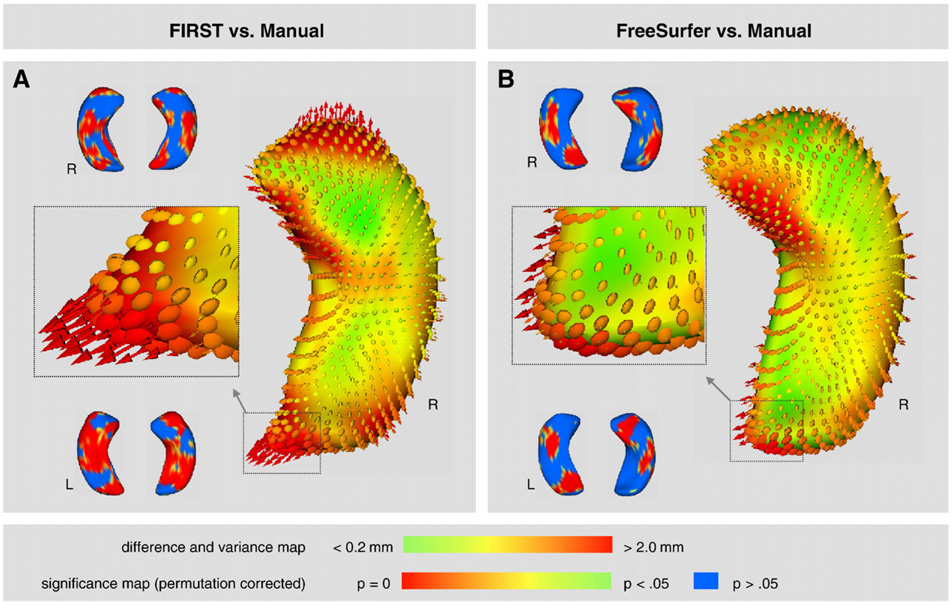
Fig. 9.
Shape analysis of the hippocampus in 3-D where difference maps show the distance between segmentation contours thresholded from 0.2mmto 2.0 mm. Vectors indicate the directionality between the corresponding mesh vertices of the two segmentation methods. Ellipsoids indicate the [x, y, z] components of variance introduced by the automated segmentation. Significance maps (permutation corrected, p<0.05) highlight shape differences between automated segmentation and manual tracing. (A) FIRST compared to manual tracing, and (B) FreeSurfer compared to manual tracing.

