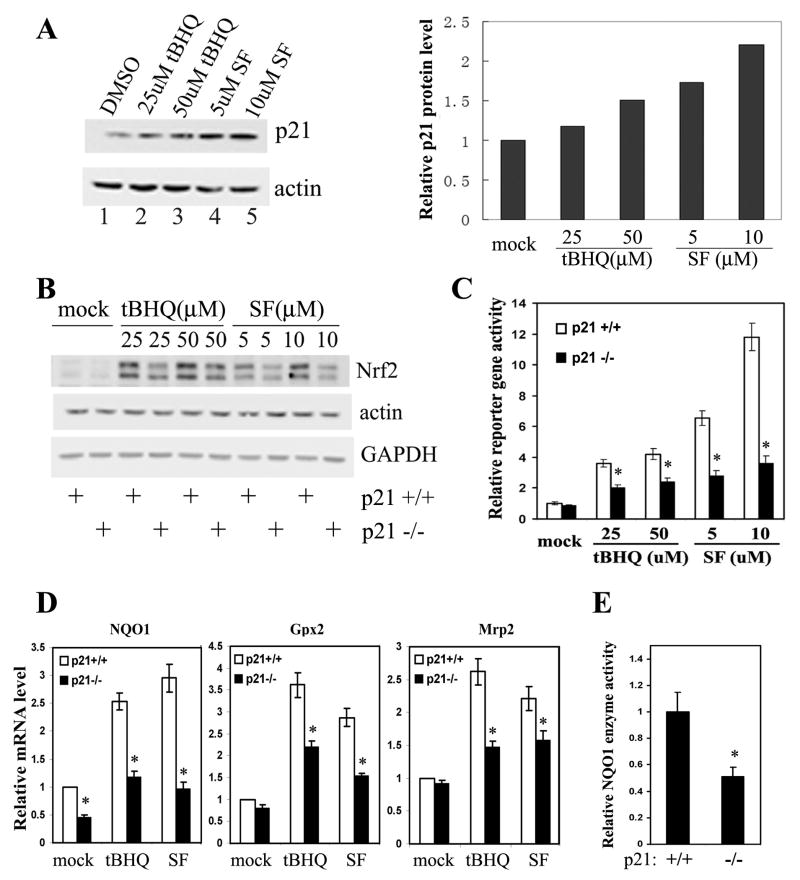
Figure 3. HCT116-p21-/- Cells had Reduced Basal and Induced Levels of the Nrf2-Dependent Antioxidant Response.
(A) p21 was upregulated in response to oxidative stress. HCT116-p21+/+ cells were either untreated or treated with the indicated compounds for 16 hrs. Endogenous p21 and β-actin were detected with anti-p21 and anti-β-actin antibodies (left panel). The band intensity of p21 and β-actin was quantified and the p21 protein level was normalized to the β-actin protein and plotted (right panel). (B) The basal and induced Nrf2 protein levels were lower in HCT116-p21-/- cells. HCT116-p21+/+ or HCT116-p21-/-cells were either untreated or treated with different doses of tBHQ or SF for 16 hrs. Endogenous Nrf2 was detected with an anti-Nrf2 antibody. Nrf2 appears as a double band because a lower percentage gel (7.5%) was used. (C) Knockdown of p21 diminished the transcriptional activity of Nrf2. HCT116-p21+/+ and HCT116-p21-/- cells were transfected with expression vectors for NQO1-ARE firefly luciferase and TK-renilla luciferase. The transfected cells were treated with the indicated concentration of tBHQ or SF for 16 hrs prior to the measurement of luciferase activities. The standard deviations were calculated from three independent experiments, each with duplicate samples. *p<0.05 compared with its control. (D) mRNA expression of the Nrf2-downstream genes were reduced in HCT116-p21-/- cells. HCT116-p21+/+ and HCT116-p21-/- cells were either left untreated, or treated with 50 μM tBHQ or 10 μM SF for 16 hrs. Relative amounts of NQO1, Gpx2, and Mrp2 mRNAs were measured by qRT-PCR. The standard deviations were calculated from triplicate samples. *p<0.05 compared with its control. (E) HCT116-p21-/- cells had lower NQO1 activity. NQO1 enzyme activity in HCT116-p21+/+ and HCT116-p21-/- cells was measured as the dicoumarol-inhibitable fraction of DCPIP reduction. NQO1 activity was normalized to the total protein level and the standard deviations were calculated from triplicate samples. *p<0.05 compared with its control.

