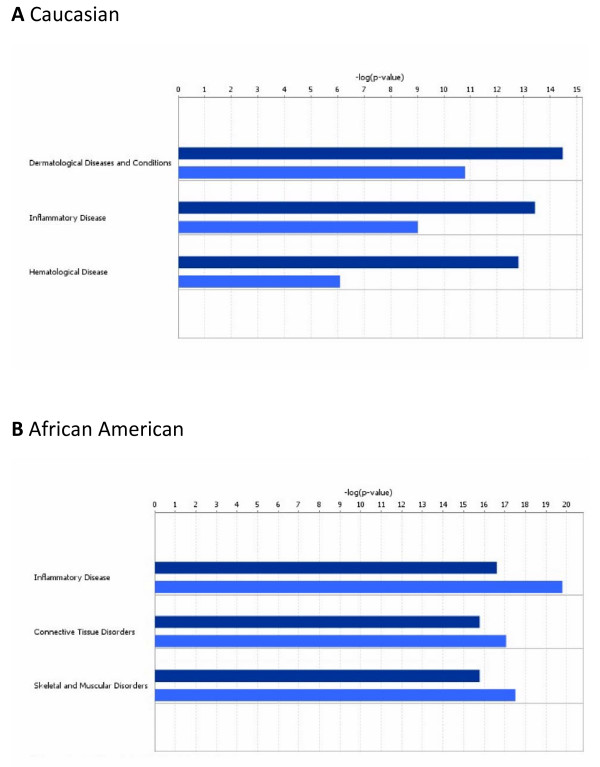
Figure 1.
Top disease and disorder functions determined by IPA to be overrepresented by focus genes. Panel A, Caucasian mothers and their fetuses; panel B, African American mothers and their fetuses. Dark blue bars, maternal; light blue, fetal. The p-value for a given diseases and disorder annotation is calculated by the IPA software using Fishers Exact Test taking into account the number of focus genes that participate in that process in relation the total number of genes associated with that process in the IPA knowledgebase.

