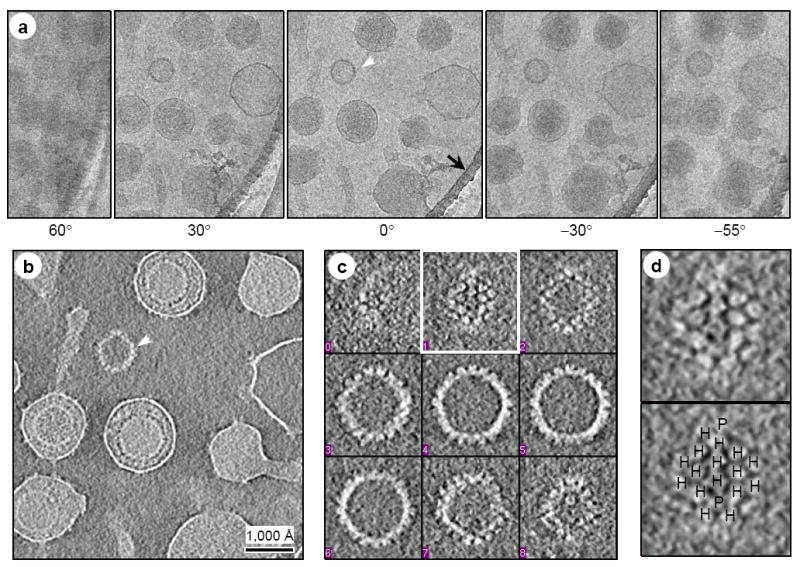
Figure 2. CryoET tilt series and quality assessment of the tomograms (see Supplementary Movie 1).

(A) Representative image frames from a typical cryoET tilt series of ice-embedded MHV-68 particles. This tilt series is chosen because a naked capsid (white arrowhead) is present in the field for validation of 3D reconstruction. A small portion of the carbon support film (indicated by black arrow) of the holey grid was included to reduce specimen charging during imaging. (B) A 15-Å thick slice taken from the 3D volume reconstructed from the tilt series in (A). The naked capsid is indicated by the arrowhead. (C) Density distribution in representative serial slices (15-Å thick each) extracted from the naked capsid indicated in (B). Note that individual capsomers are clearly revealed. (D) Individual capsomers, resembling those in the single-particle cryoEM reconstruction (Fig. 1B and Fig. 4B), are visible in the close-up of the slice boxed in (C). Hexons (H) and pentons (P) are indicated in the bottom panel. Following accepted convention, protein densities in the 3D reconstructions are displayed as white and background as dark, which is opposite to that used for displaying raw image data.
