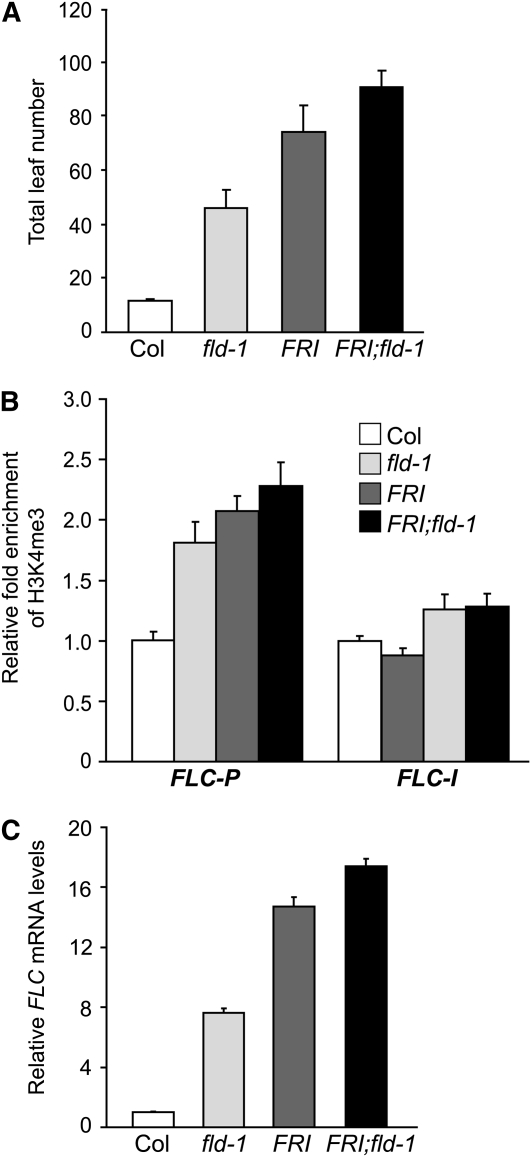
Figure 8.
Effect of FRI and Loss of FLD Activity on H3K4me3 in FLC Chromatin and FLC Upregulation.
(A) Flowering times of Col, fld-1 (a weak allele), FRI-Col, and FRI;fld-1 grown in long days. The total number of primary rosette and cauline leaves at flowering was scored, and 13 to 15 plants for each line were counted. The values shown are means ± sd.
(B) Relative levels of trimethyl H3K4 in FLC chromatin in Col, fld-1, FRI-Col, and FRI;fld-1seedlings. The fold changes of the indicated genotypes over Col at the indicated regions are shown (Col and FRI-Col as described in Figure 6D). Data in the graphs are average values from two ChIP experiments (each quantified in triplicate), and error bars represent sd. The examined regions are as illustrated in Figure 6A. (C) Relative FLC mRNA levels in seedlings of Col, fld-1, FRI-Col, and FRI;fld-1quantified by real-time PCR. Relative expression to Col is presented, with sd for three quantitative PCR replicates.

