Figure 6.
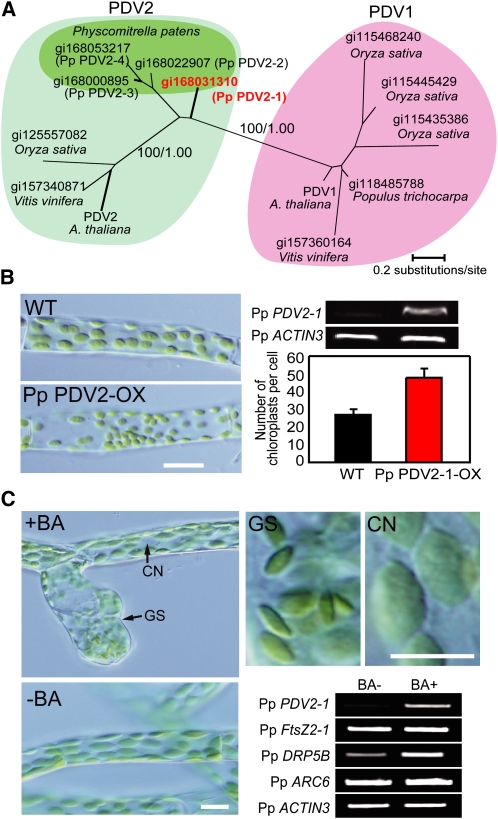
PDV2 also Rate-Determines Chloroplast Division in the Moss P. patens.
(A) Phylogenetic relationships in the PDV family of proteins. The amino acid sequences were collected from the National Center for Biotechnology Information database of nonredundant protein sequences. The GI numbers of the respective amino acid sequences are indicated. The tree shown is the maximum likelihood tree constructed by the RaxML program (Stamatakis, 2006) based on the alignment of 144 amino acid residues of 13 proteins. The numbers at the selected nodes are local bootstrap values (left) and Bayesian posterior probabilities (right) calculated by the maximum-likelihood method and Bayesian inference analyses, respectively.
(B) Number of chloroplasts per chloronema cells of the wild type and Pp PDV2-1 overexpresser (Pp PDV2-OX) (n = 30 cells). In P. patens, protonema cells are classified into chloronema and caulonema. Chloronema, which contains round chloroplasts, develops to caulonema, which contains spindle-shaped chloroplasts. An increase in number of chloroplasts was also observed in caulonemal cells of the Pp PDV2-1 overexpresser. RT-PCR analyses showing the Pp PDV2-1 transcript is increased in the transgenic line. Total RNA extracted from protonemal colonies was used for RT-PCR. Pp ACTIN3 was used as the internal control. The number of PCR cycles was 28 for Pp PDV2-1 and 28 for Pp ACTIN3. The signals were estimated by ethidium bromide staining. The same results were obtained in four independent transformants. Bar = 10 μm.
(C) Effect of cytokinin treatment on chloroplasts and expression of chloroplast division genes. RT-PCR analyses comparing transcript levels of chloroplast division genes between cells grown on medium with (+BA) or without (−BA) BA. Four-day-old protonemal cells were transferred onto medium with or without 5 μM BA and grown for 4 d. Pp ACTIN3 was used as the internal control. The number of PCR cycles was 28 for each gene. The signals were estimated by ethidium bromide staining. Two biological replicates showed the same result. CN, caulonema; GS, gametophore shoot apical cell of a bud induced by cytokinin. Bars = 10 μm.
[See online article for color version of this figure.]

